Figure 7.

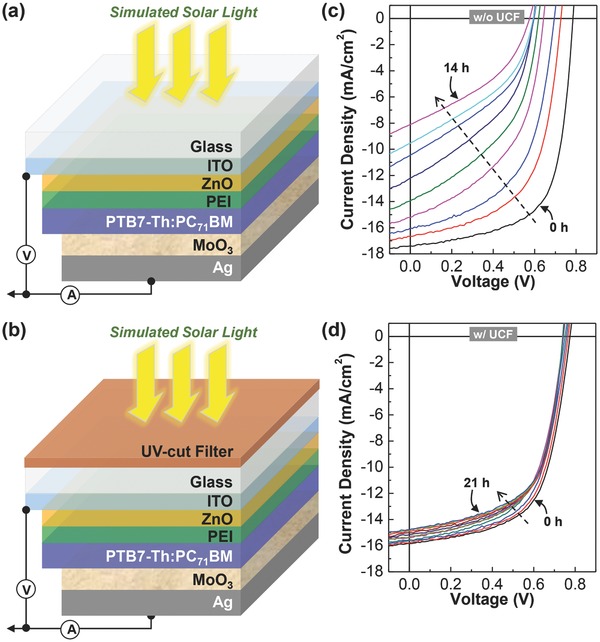
a,b) Structure of glass/ITO/ZnO/PEI/PTB7‐Th:PC71BM/MoO3/Ag solar cells without a) and with b) UCF. c,d) Current density–voltage (J–V) curves of glass/ITO/ZnO/PTB7‐Th:PC71BM/MoO3/Ag solar cells under continuous illumination with simulated solar light (air mass 1.5G, 100 mW cm−2): c) without UCF for 14 h and d) with UCF for 21 h. Note that the incident light intensity was reduced by ≈20% for the device with UCF
