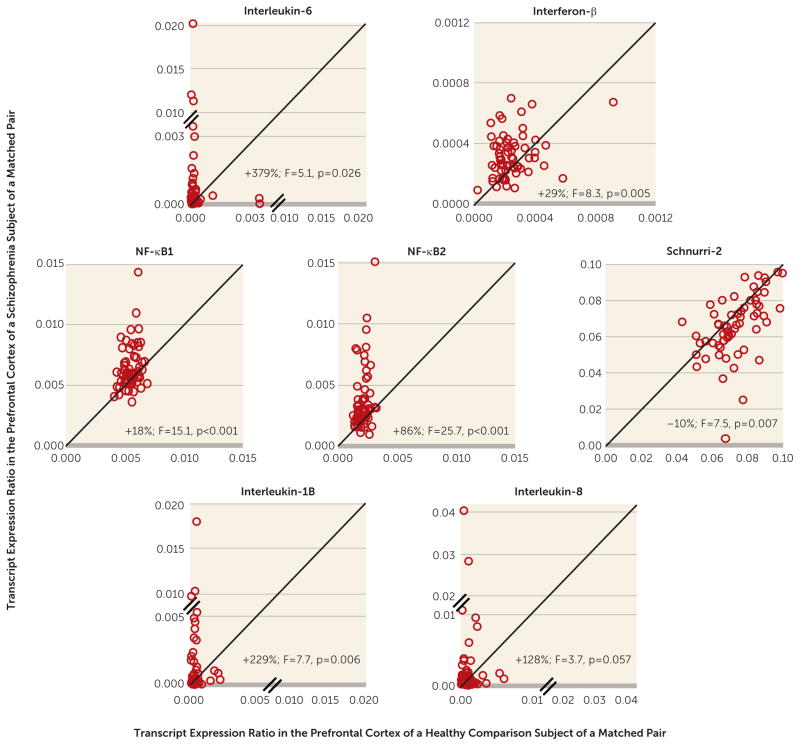
FIGURE 2. Quantitative PCR Analysis of mRNA Levels of Immune System-Related Cytokines and Transcriptional Regulators in the Prefrontal Cortex in Schizophrenia a.
aPCR=polymerase chain reaction. Transcript levels for each schizophrenia subject relative to the matched nonpsychiatric comparison subject are indicated by open circles. Data points to the left of the unity line indicate higher mRNA levels in the schizophrenia subject relative to the nonpsychiatric comparison subject. Percent difference in diagnostic group means and primary statistical analysis results are provided for each quantified mRNA (df=1, 117 in all analyses).

