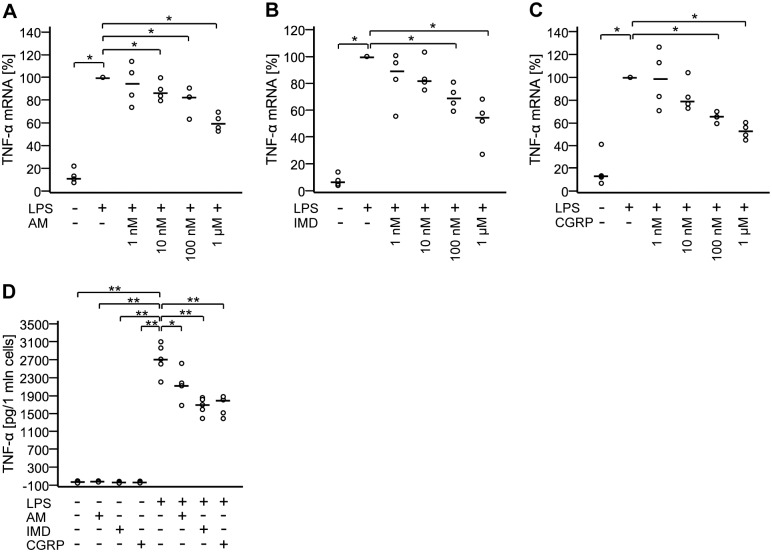
Fig 6. AM, IMD, and CGRP attenuate production of TNF-α.
A-C) NR8383 cells were treated with LPS (100 ng/ml) with or without AM, IMD, or CGRP at indicated concentrations for 24 h. TNF-α mRNA expression was analyzed by RT-qPCR. Data is presented as relative mRNA expression, normalized to LPS-treated cells. Bar represents median. N = 4. *, p≤0.05 (Mann-Whitney test). D) NR8383 cells were treated with LPS (100 ng/ml) with or without AM, IMD, or CGRP (each at 100 nM) for 24 h and TNF-α levels in the culture media were measured by ELISA. Bar represents median. N = 5. *, p≤0.05; **, p≤0.01 (Mann-Whitney test).

