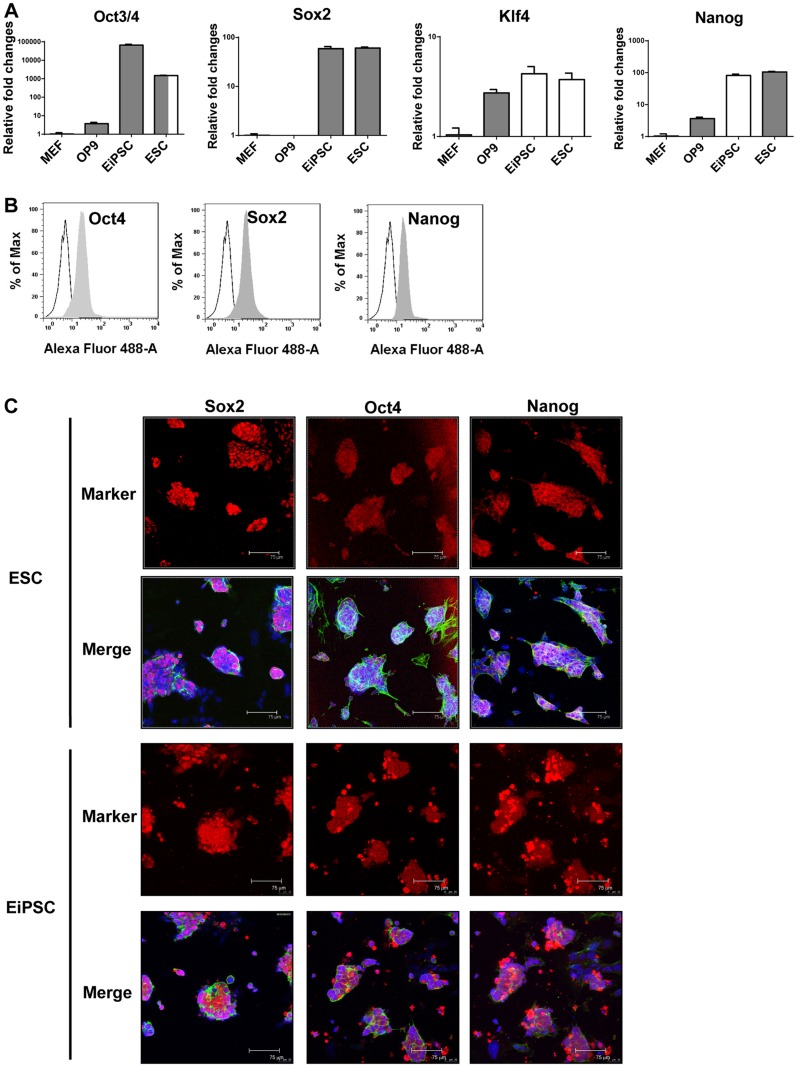
Fig 2. Characterization of EiSPCs.
(A) The mRNA expression levels of pluripotent genes were quantified by real-time PCR in MEFs, OP9, EiPSCs and ESCs. (B) The pluripotent protein levels within EiPSCs were quantified using flow cytometry analysis. (C) Confocal microscopy images of immunocytochemistry staining for pluripotent protein expression in both EiPSCs and ESCs. Red fluorescence represents pluripotent protein expression whereas blue fluorescence represents DAPI staining for cell nuclei. Green fluorescence represents β-actin staining. Each scale bar represents 70 μm.

