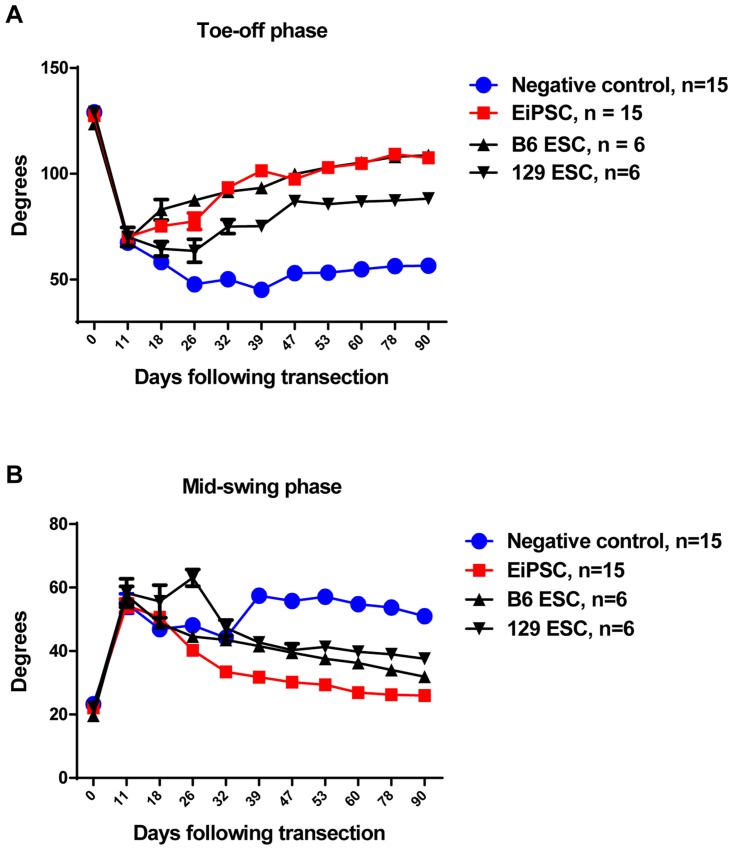
Fig 4. Functional recovery evaluated using video gait analysis.
(A) Ankle angles during the toe-off phase post sciatic nerve transection in four groups. The statistical data comparing EiPSC, 129 ESCs and B6 ESCs groups between negative control showed a mean±SEM difference which was significant (P value of < 0.0001, one-way ANOVA). (B) Ankle angles during the mid-swing phase post sciatic nerve transection in four groups. The statistical data comparing EiPSC, 129 ESCs and B6 ESCs groups between negative control showed a mean±SEM difference which was significant (P = 0.0063, one-way ANOVA).

