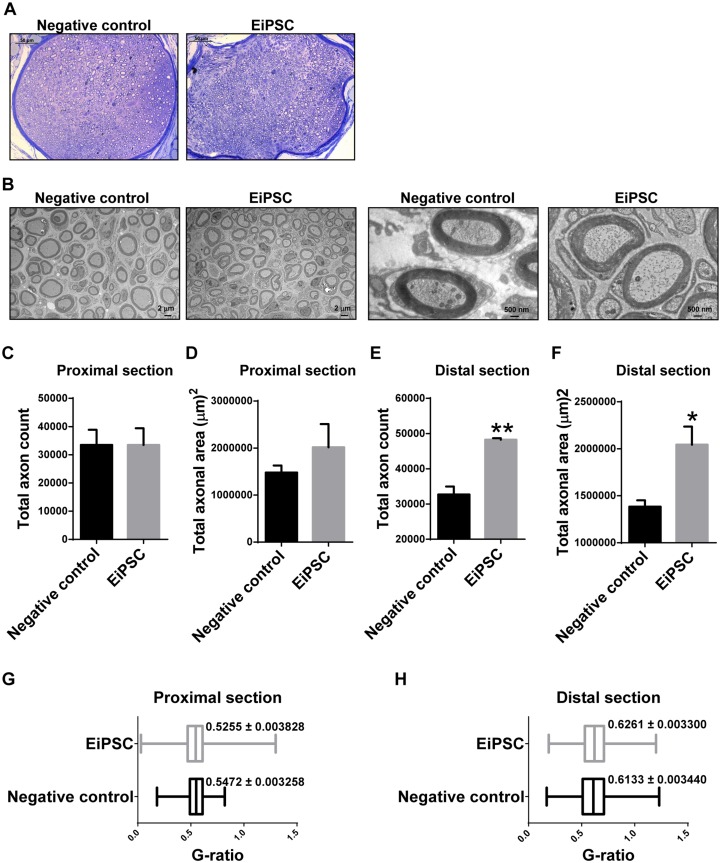
Fig 5. Stereographic analysis of sciatic nerve regeneration.
(A) Toluidine blue staining of fascicles in the distal section of regenerated sciatic nerves. Each scale bar represents 50 μm. (B) Electron microscopy of regenerated axons in both negative control and EiPSC groups at the distal sections. The scale bars for two images on the left are 2 μm each and 500 nm for two images on the right. (C, E) Total axon count in the proximal (C) and distal (E) section of regenerated sciatic nerves. (D, F) Total axonal area in the proximal (D) and distal (F) section of regenerated sciatic nerves. (G-H) G-ratio comparing the proximal (G) and distal (H) section of regenerated sciatic nerves in both EiPSC and negative control groups.

