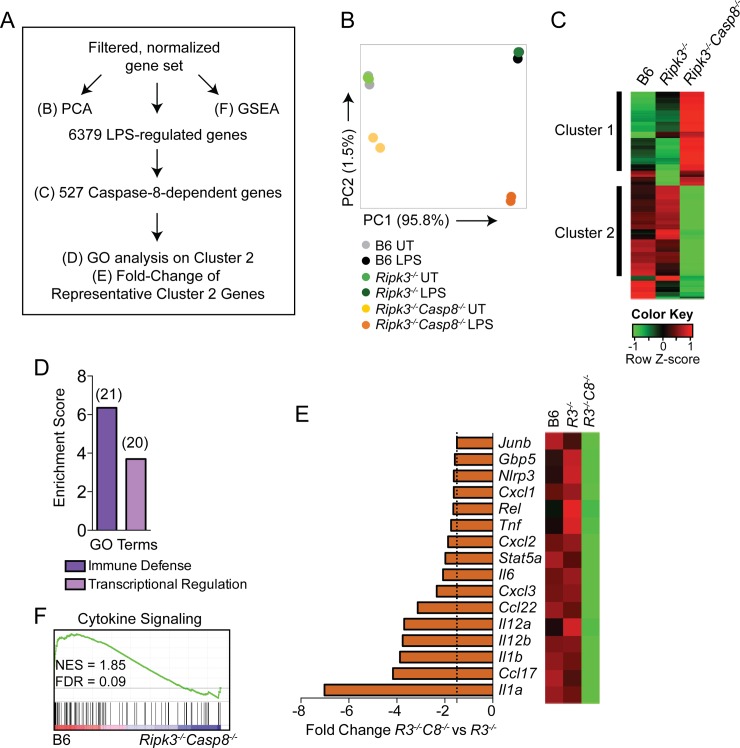
Fig 3. Caspase-8 regulates a functionally important subset of LPS-induced genes.
RNA was extracted from B6, Ripk3 -/- and Ripk3 -/- Casp8 -/- BMDMs following 6 hours of LPS treatment (100 ng/mL) and RNA-seq was performed. (A) Schematic of analysis of the data obtained from RNA-seq indicating figure panel where the results of each type of analysis is shown. (B) Principal Component Analysis (PCA) of filtered, normalized gene set displaying PC1 (95.8% of variance) against PC2 (1.5% of variance). (C) Hierarchical clustering by Pearson correlation of differentially expressed LPS-responsive caspase-8-dependent genes. Columns represent genotype and rows represent individual genes. Colored to indicate expression levels based on Z-scores. (D) GO enrichment performed in DAVID showing Biological Process terms enriched in cluster 2 from (C). Number of genes in each group are denoted above bars. Genes in cluster 1 did not show significant enrichment for any Biological Process terms. (E) Differential expression of select genes from cluster 2 and fold change (LPS-treated Ripk3 -/- Casp8 -/- vs LPS-treated Ripk3 -/- BMDMs). Dotted line represents 1.5-fold cutoff. (F) GSEA showing enrichment in cytokine signaling from the KEGG MSigDb canonical pathways collection 2 comparing B6 and Ripk3 -/- Casp8 -/- LPS-treated BMDMs. GO, gene ontology; DAVID, database for annotation visualization and integrated discovery; GSEA, gene set enrichment analysis; KEGG, Kyoto Encyclopedia of Genes and Genome; NES, normalized enrichment score; FDR, false discovery rate. R3C8 = Ripk3 -/- Casp8 -/-. See also S3 and S4 Figs.

