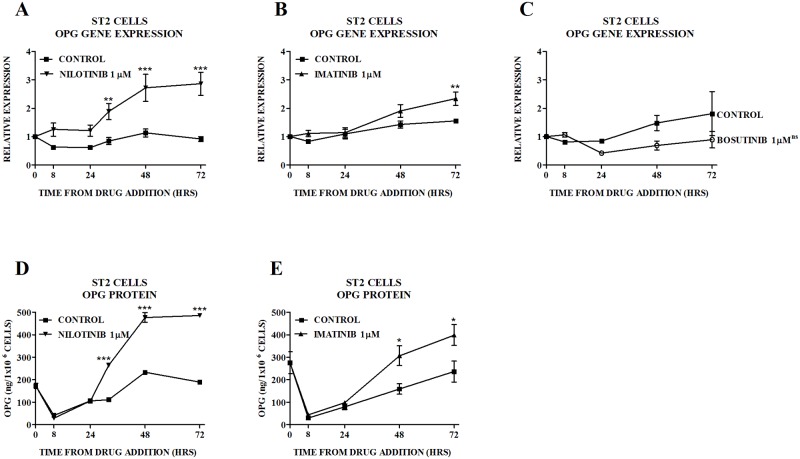
Fig 1. Effect of TKIs on OPG in ST2 Cells.
Effect of nilotinib on OPG (A) gene expression and (D) protein production. Figs 1A and D have previously been published [29] (S2 File) and are reproduced for illustrative purposes with permission (S1 File). Effect of imatinib on OPG (B) gene expression and (E) protein production. (C) Effect of bosutinib on OPG gene expression. Gene expression is quantitated relative to the baseline control value. In the case of ST2 cells treated with bosutinib, individual time-points were not significantly different from control, thus the p-value for the overall difference between the treatment group and the control group is shown on Fig 1E. Data are mean ± SEM. nsnot significant, *p<0.05, **p<0.01, ***p<0.001 vs untreated control.

