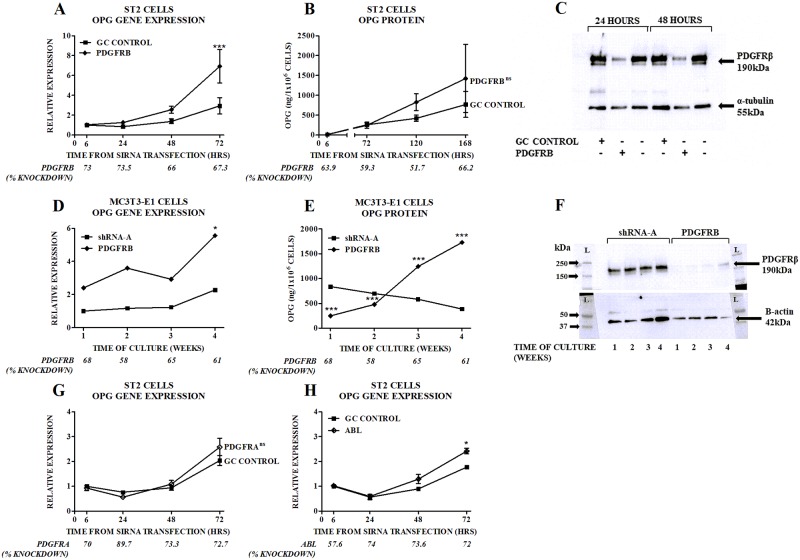
Fig 5. Effects of PDGFRB Gene Silencing on OPG in ST2 and MC3T3-E1 Cells.
Effects of siRNA targeting PDGFRB on (A) expression of OPG mRNA in ST2 cells and (B) production of OPG protein by ST2 cells. The level of gene silencing achieved is indicated in the second row of the x-axis of each graph. Gene expression is quantitated relative to the baseline control oligo value. Data are mean ± SEM. ***p<0.001 vs control oligo. OPG protein levels were not significantly different at individual time-points between ST2 cells with PDGFRB gene silencing and those with control oligo, thus the p-value for the overall difference between the two groups is shown on Fig 5B. (C) Effects of siRNA targeting PDGFRB on PDGFRβ protein levels. The immunoblot presented is representative of at least three separate experiments. OPG gene expression (D) or protein secretion (E) in PDGFRB shRNA transduced MC3T3-E1 cells. The level of PDGFRB gene expression or protein is shown on the x-axis. Gene expression is quantitated relative to the levels in SHRNA-A control cells at baseline. Data are mean. (F) PDGFRβ protein levels in PDGFRB shRNA transduced MC3T3-E1 cells. Effects of siRNA targeting (G) PDGFRA or (H) ABL on expression of OPG mRNA in ST2 cells. Gene expression is quantitated relative to the baseline control oligo value. Data are mean ± SEM. * p<0.05 vs control oligo. OPG gene expression was not significantly different at individual time-points between ST2 cells with PDGFRA gene silencing and those with control oligo, thus the p-value for the overall difference between the two groups is shown on Fig 5G.

