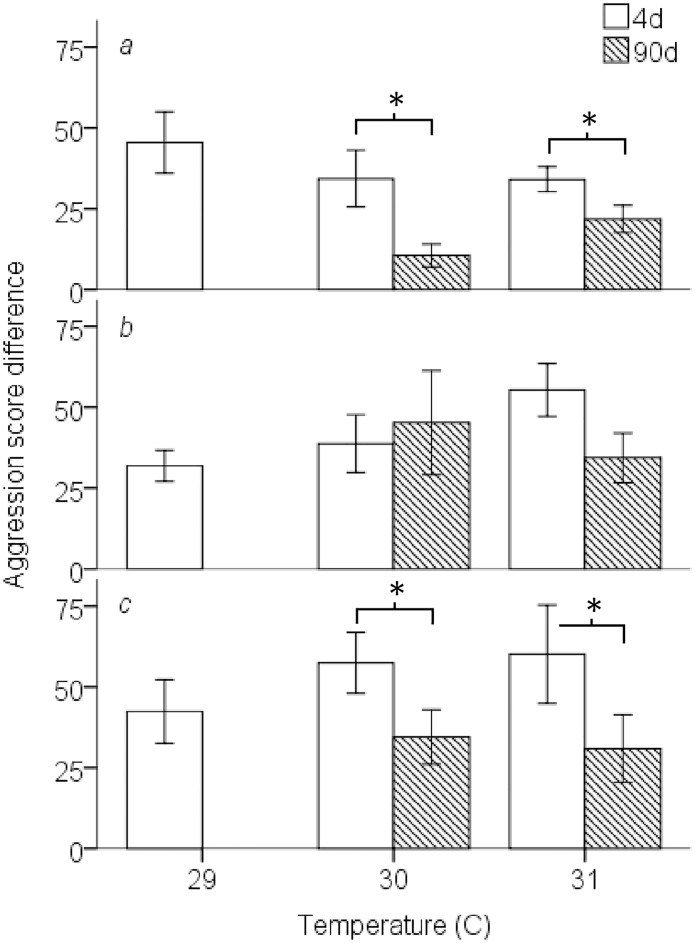
Fig 2. Mean aggression score difference ± SE, calculated as winner fish score minus loser score, between competitors by temperature of 4d (grey) and 90d exposure treatments (open).
Species composition listed by row: intraspecific Pomacentrus amboinensis (a), intraspecific P. moluccensis (b), and interspecific (c). Statistical significance (p < 0.05) between 4d and 90d treatments represented with (*). All treatments n = 10.

