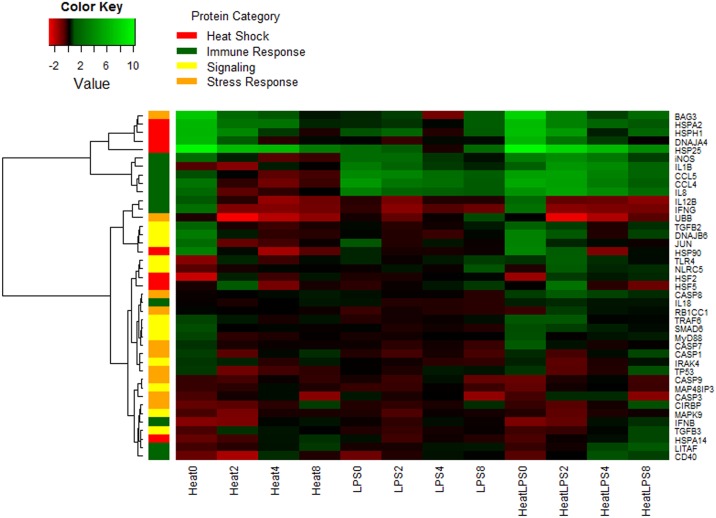
Fig 2. Log2 Fold Change Heat Map.
A heat map for the 3 different treatments across the 4 time points. Log2 fold change calculate based on delta Ct value compared to the control samples and green implies increased expression while red implies decreased expression. Genes on the right are clustered using a hierarchical clustering method and 8 clusters were found. Cluster 1 = BAG3, HSPA2, HSPH1, DNAJA4, HSP25; Cluster 2 = iNOS, IL1B, CCL5, CCl4, IL8; Cluster 3 = IL12B, IFNG, UBB; Cluster 4 = TGFB2, DNAJB6, JUN, HSP90; Cluster 5 = TLR4, NLRC5, HSF2, HSF5; Cluster 6 = CASP8, IL18, RB1CC1, TRAF6, SMAD6, MyD88, CASP7, CASP1, IRAK4, TP53; Cluster 7 = CASP9, MAP48IP3, CASP3; Cluster 8 = CIRBP, MAPK9, IFNB, TGFB3, HSPA14, LITAF, CD40. Each gene is color coded based on their major functional category: heat stress response (red), immune response (green), signaling (yellow), and stress response (orange).

