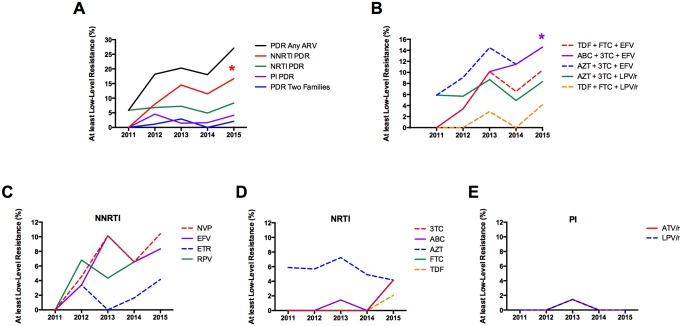
Fig 4. PDR temporal trends.
PDR was estimated by year of enrolment using the HIVdb tool from Sanger sequences. Individuals with drug resistance were defined as those with at least low-level resistance (Stanford penalty score ≥15) to any drug of the corresponding class. A. PDR temporal trends by drug class. B. PDR temporal trends for the most widely used antiretroviral regimens in Nicaragua. C-E PDR temporal trends by drug, divided by drug class; only drugs currently used in clinical practice in the Nicaraguan context are shown. *p<0.05; linear regression, slope different to 0; the color corresponds to the significant category.

