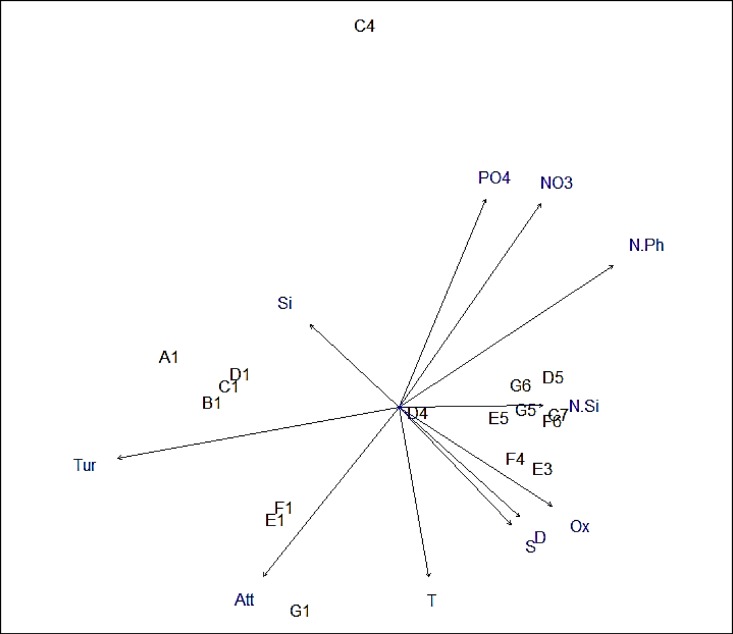
Fig 11. Vectors of environmental factors plotted on the nMDS ordination of species composition indicating the relation between environmental factors and species composition.
The value of an environmental factor increases towards the direction of the arrow while significance is indicated by arrow length (Tur = Turbidity, Att = light attenuation, T = temperature, S = salinity, D = density, NO3 = nitrate, PO4 = phosphate, Si = silicate, N.Ph = nitrate to phosphate ratio, N.Si = Nitrate to silicate ratio).

