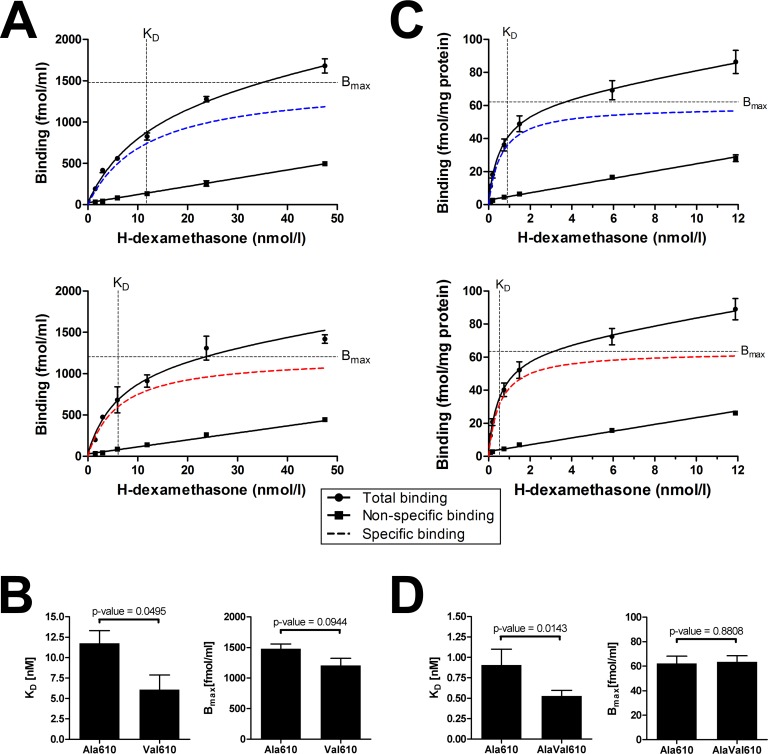
Fig 4. In vitro and in vivo glucocorticoid receptor binding assays.
Dexamethasone binding assays were performed for transfected Cos-7 cells (in vitro; A and B) and for cytosolic fractions of pituitary glands (in vivo; C and D). For Cos-7 cells, specific binding curves (A) were plotted based on three independent experiments for Ala610 GR (blue) and Val610 GR (red). For pituitary glands, homozygous carriers of wild-type GR (Ala610 GR; blue) and heterozygous carriers of mutant GR (AlaVal610 GR; red) were analyzed (C). Dashed lines indicate the estimated dissociation constant (KD) and the maximum specific binding (Bmax), respectively. Comparisons of KD and Bmax between groups are illustrated for the in vitro (B) and in in vivo (D) binding assay as means ± SEM.

