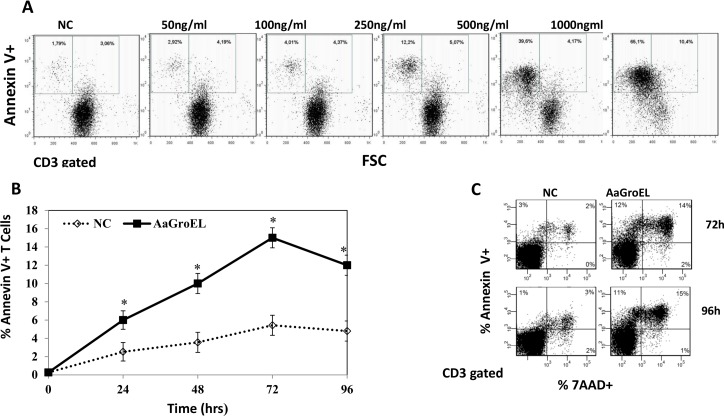
Fig 2. GroEL induces T-cell apoptosis as assessed by exposure of phosphatidylserine.
(A) Dose-response of AaGroEL. PBMCs were cultured for 48 h with various AaGroEL concentrations (1–1000 ng/mL). CD3-gated dot plots of Annexin V labeling versus forward light scatter (FSC) are shown. The windows demarcate two subsets of Annexin V-positive T lymphocytes: the left window displays small-sized lymphocytes, and the right window displays medium-sized lymphocytes. (B) Time kinetics of AaGroEL. PBMCs were cultured with AaGroEL (250 ng) for various intervals (0–96 h). RPMI was used as a negative control and camptothecin (CPT, 4 μM) was used as a positive control. The cultured cells were labeled with anti-CD3 antibody, Annexin V and 7AAD followed by flow cytometric analysis. Error bars represent the standard deviation, and * indicates p<0.05. The data are representative of 6 experiments. (C) Representative flow cytometric profile of apoptotic T cells at 72 h and 96 h. Cells were gated for T lymphocytes based on CD3 expression. The proportion of Annexin V-positive T cells (pre-apoptotic) is indicated in the upper left quadrant of each panel, and Annexin V and 7AAD double-positive (apoptotic/necrotic) T cells are indicated in the upper right quadrant of each panel. The presented data are from one of six experiments.

