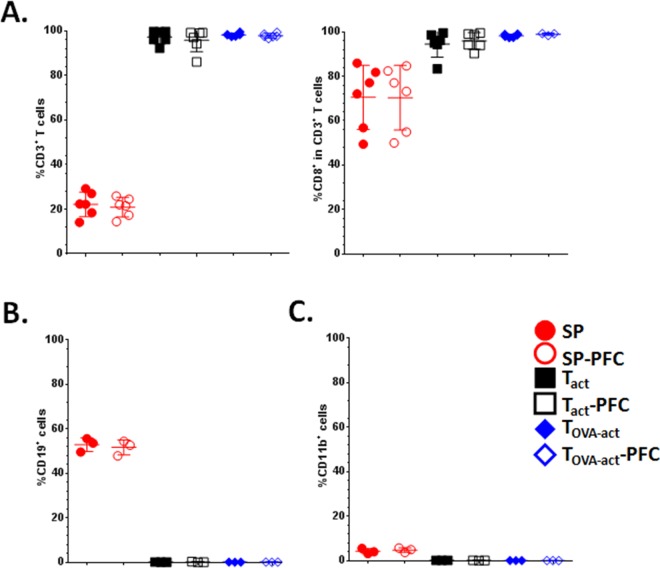
Fig 2. Phenotype of total splenocytes (SP), anti-CD3/anti-CD28 activated (Tact) and Ova-peptide activated (TOVA-act) splenocytes from OT-1 cells, before and after PFC labelling.
(A) Percentage of CD3+ T cells in the total population and proportion of CD8+ T cells in CD3+ population. (B) and (C) Percentage of CD19+ and CD11b+ cells in the total population. (n = 3 for each group of cells)

