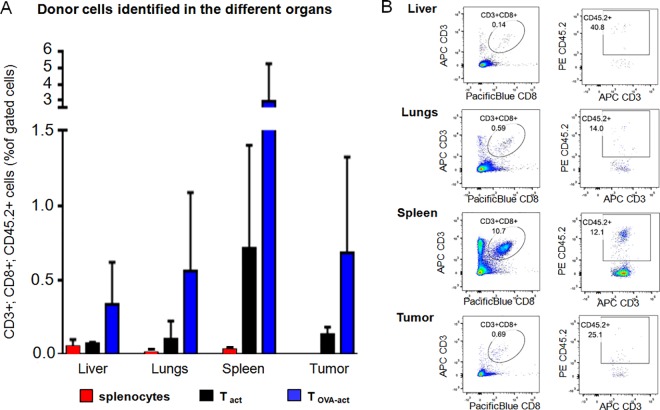
Fig 10. Flow cytometry analysis of the donor T cells (CD3+; CD8+; CD45.2+) found in the organs.
(A) Amount of (CD3+; CD8+; CD45.2+) cells in the liver, lungs, spleen, and tumor. Cell suspensions from the organs were stained with monoclonal antibodies for CD3 and CD8 together with monoclonal antibody for CD45.2 to identify adoptively transferred cells. Gating was performed on CD3+; CD8+ cells with subsequent analysis of CD45.2+ (to differentiate the host cells (CD45.1+) from transplanted cells (CD45.2+)). Data are expressed in CD3+; CD8+; CD45.2+ cells as percent of gated cells. (B) Data from one representative Tact injected mouse are shown for the different organs analyzed.

