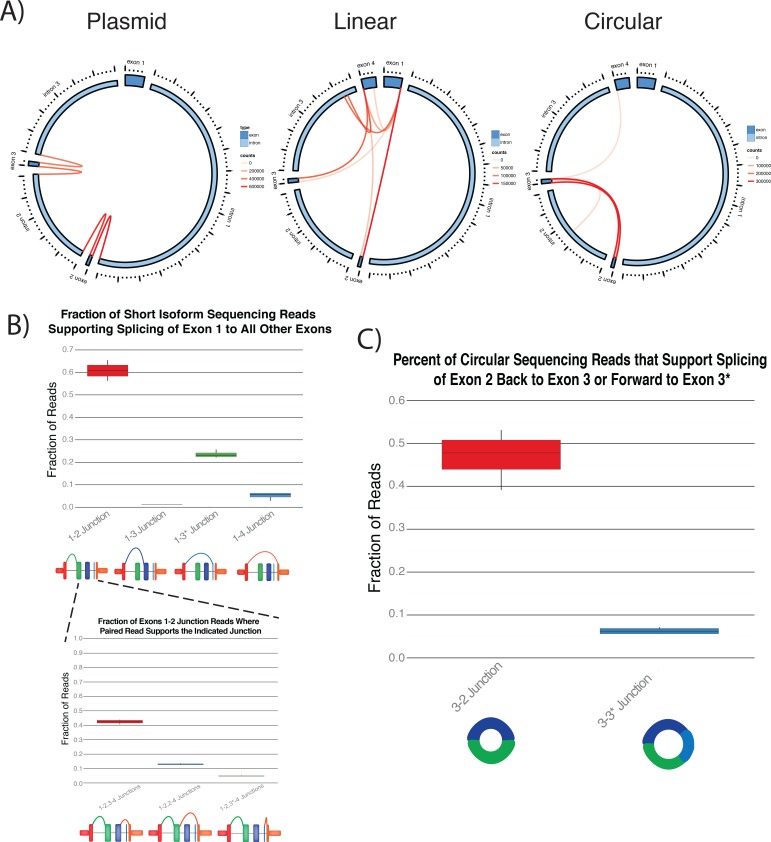
Fig 4. Global Identification of ASXL1 Splice Products after Overexpression of the ASXL1 Locus.
A) Exons and introns are depicted around the plot. Locations where a breakpoint was identified are represented by connecting lines, where the color of the line is proportional to the number of reads corresponding to that junction. Unknown junctions were almost exclusively restricted to exon-exon boundaries. Only breakpoints with greater 1% of reads supporting the junction were mapped. B) The preference of exon 1 to splice forward to exon 2, 3, 3*, or 4 were quantitated using primers that amplified from exon 1 to exon 4. The 3’ splicing junction was then quantitated for reads that spliced from exon 1 to 2 on the 5’ end. Most reads corresponded to the expected consecutive junctions, but a significant minority of reads corresponded to non-canonical junctions. C) Quantification of the circular isoforms that either included or excluded exon 3*. Of note, the abundance of the 3–2 circular isoform correlated with the abundance of the reciprocal exon skipping product from exon 1 to exon 3*.

