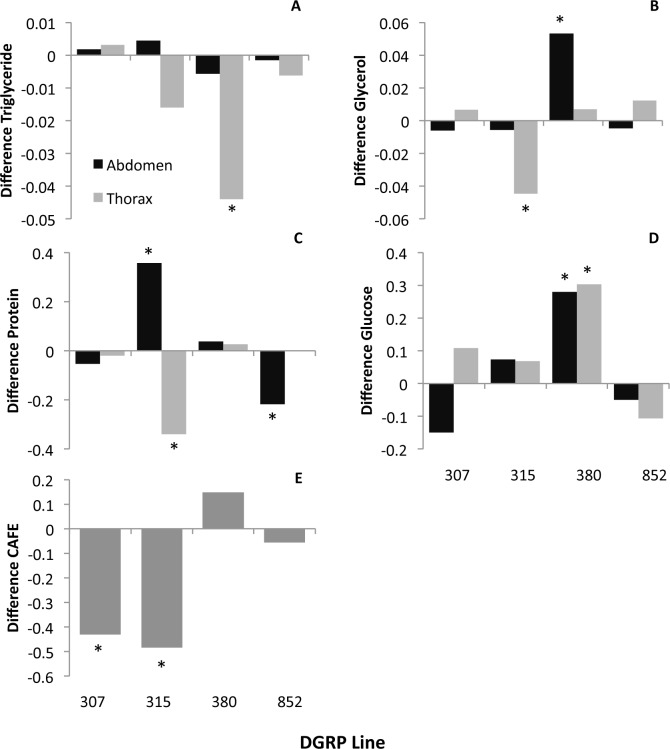
Fig 4. Exercise shows line- and tissue-specific effects on metabolic traits and line-specific effects on feeding behavior.
Data from Study B. Y-axes indicate the relative difference in the mean phenotype between the exercise and control flies (positive value indicates increase with exercise, negative value indicates a decrease with exercise) per fly equivalent. Abdomen indicated in dark grey, thorax in light grey. * indicates a significant effect of exercise at p<0.05 as determined by a post hoc student's t-test. With exercise: A. Triglycerides exhibited a significant decrease in the thorax of a single line, 380; B. Glycerol was decreased in the thorax 315 and increased in the abdomen of 380; C. Protein showed a dramatic effect of line and tissue; D. Total glucose levels increased with exercise in line 380; and E. The amount of feeding as measured by the CAFE assay was decreased in line 307 and 315.

