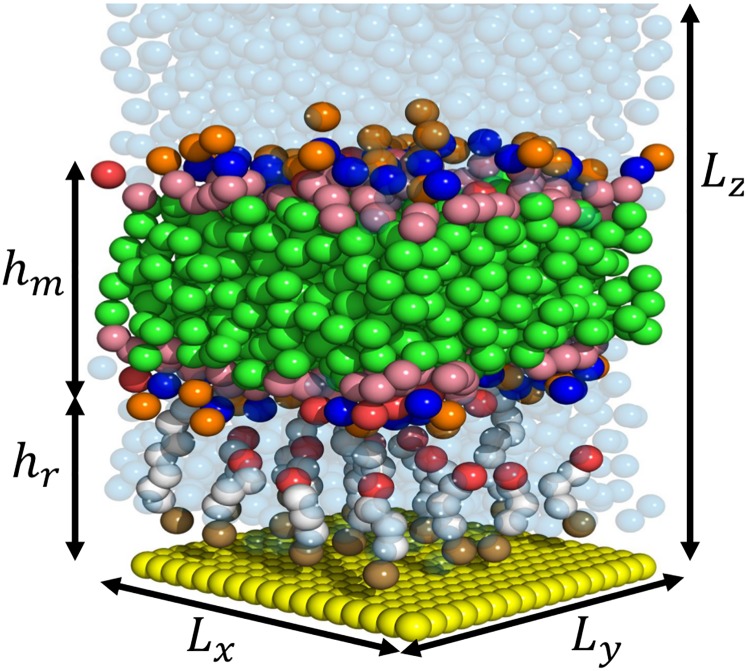
Fig 1. Schematic of the CGMD model of the tethered bilayer lipid membrane.
The green beads represent the phytanyl tail of the GDPE and DphPC lipids, NC3 bead is displayed in blue, the PO4 bead in orange, OH bead in red, the COC bead as pink, polyethylene glycol beads as white, benzyl disulphide bead as brown, gold beads as yellow, and the water beads as a translucent blue. Lz is the height of the simulation cell, Ly and Lx are the length and width of the simulation cell, hr is the tethering reservoir height, and hm is the membrane thickness.

