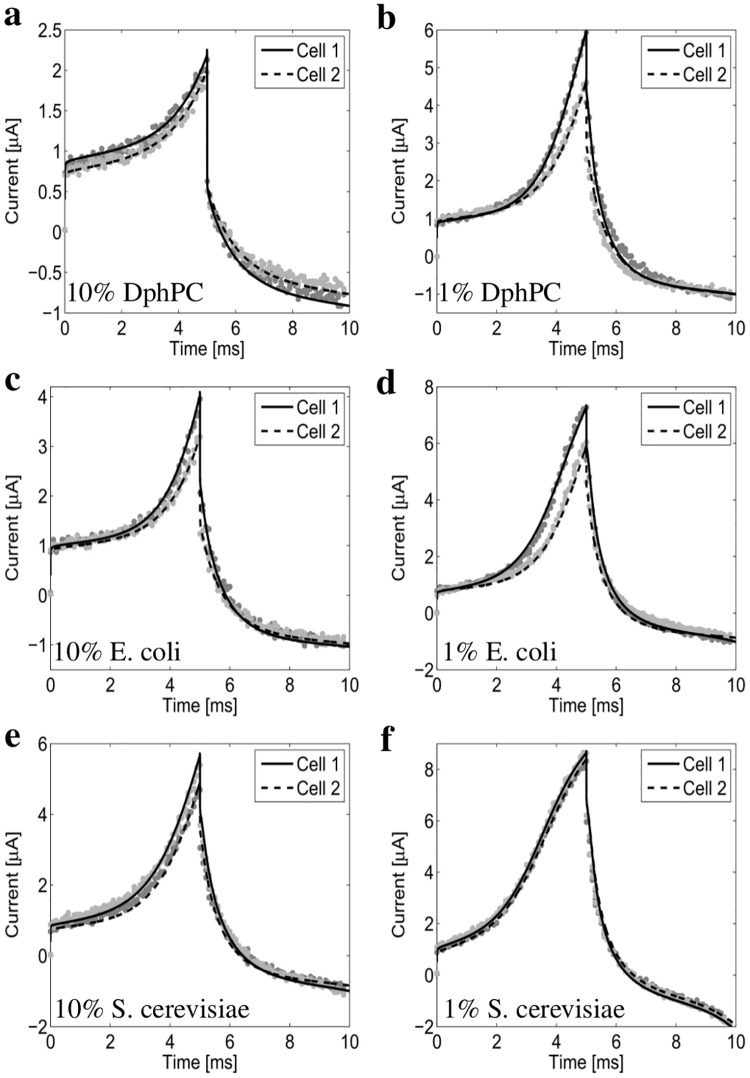
Fig 5. The measured and numerically computed current response of the 1% and 10% tether density DphPC, S. cerevisiae, and E. coli membranes.
The excitation potential Vs is defined by a linear ramp of 100 V/s for 5 ms followed by a -100 V/s for 5 ms. Cell 1 and Cell 2 denote tethered membranes prepared using an identical procedure. All numerical results are computed using the fractional order macroscopic model provided in the S1 Text.

