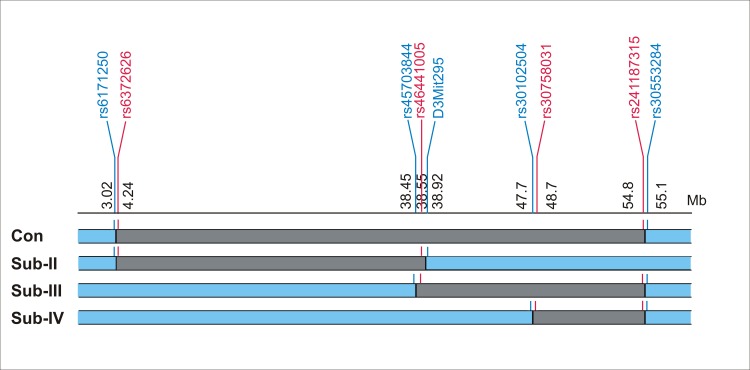
Fig 1. Map of the HIVAN1 locus, congenic and sub-congenic regions.
The rectangles depict the congenic and sub- congenic segments. The top line shows the position of the limiting markers in Mb (genome build 38p.3/mm10). The limiting markers with FVB genotypes are shown in blue, and those with CAST genotypes in red. The segments carrying CAST alleles are shown in grey. (Con = congenic strain)

