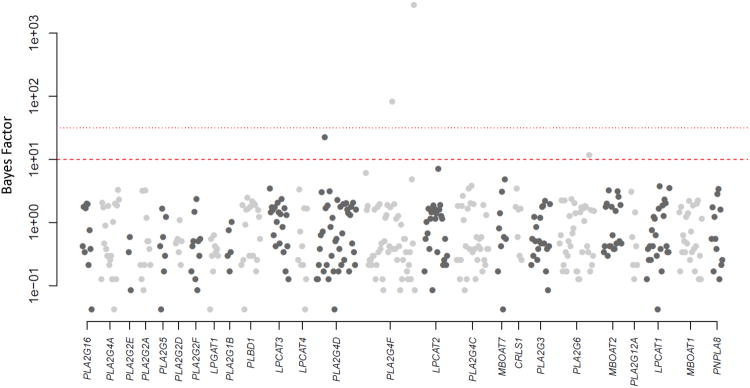
Figure 1.
Depiction of BFs (y-axis on log10 scale) for all 438 RVs within 26 genes related to pathways previously identified to have significant associations with PC risk in the data set. Colors of the points alternate by gene membership from dark gray to light gray, and the y-axis is annotated in the original scale. Horizontal lines depict BF thresholds of 10 and 31.6.

