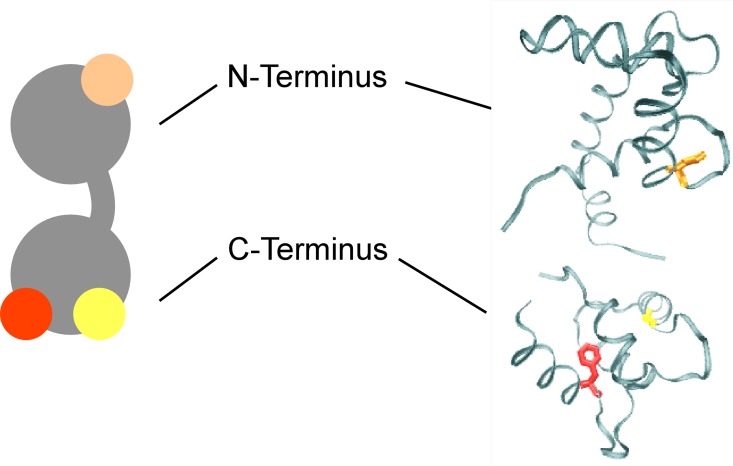
Fig 2. Schematic and crystal structure of cTnC.
cTnC is shown in a schematic representation (gray, left) and the crystal structure (PDB 1J1E, right). Mutated residues (used in a subset of studies) are: D65 highlighted in orange at the N-terminus; and D104 and D140 highlighted in red and yellow, respectively, at the C-terminus.

