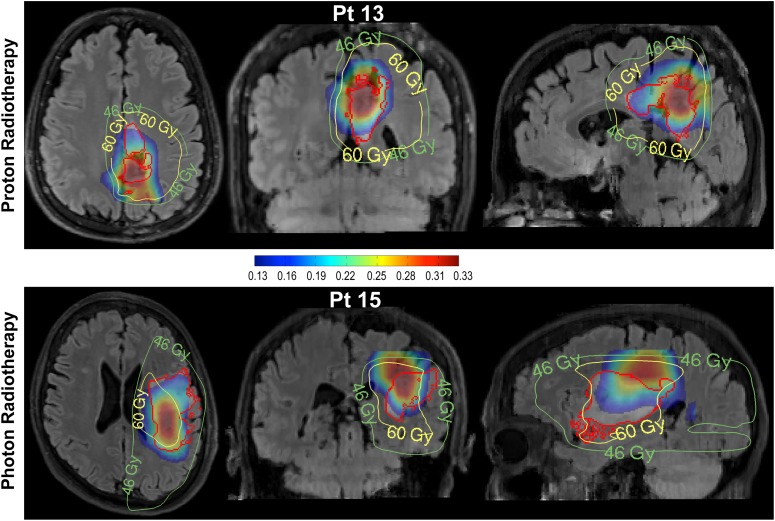
Fig. 4.
Radiation treatment plans and 2HG/hCr maps overlaid on the FLAIR image for one patient treated by proton beam therapy (upper row) and another patient treated by photon radiation therapy (lower row). The 2HG/hCr intensity scale is (0.13–0.33), radiation plans show the planned target volumes at 46 and 60 Gy. The FLAIR ROI is shown by the red contour.

