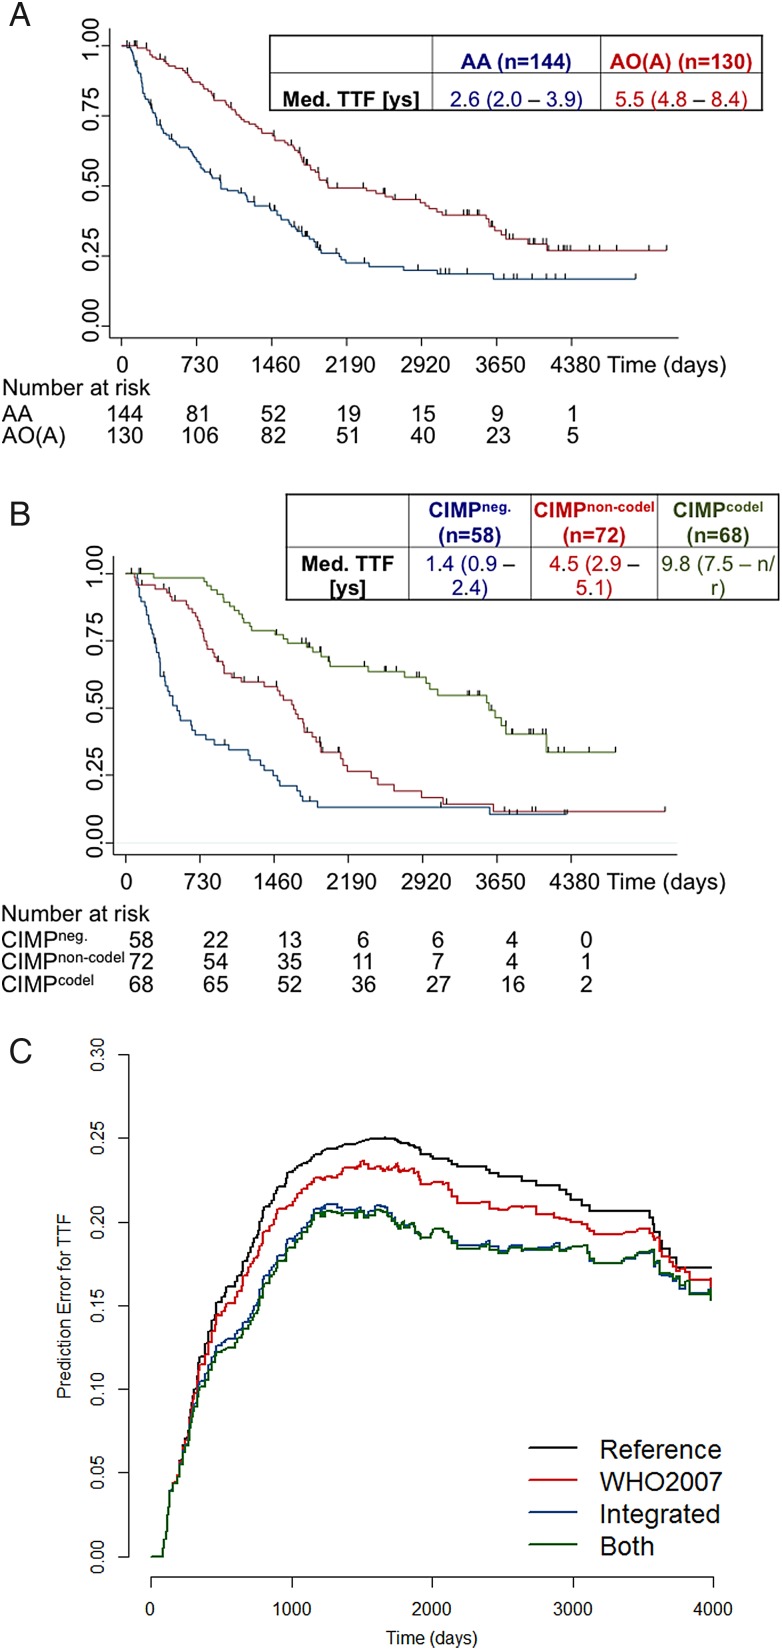
Fig. 3.
Efficacy outcomes according to histological and molecular subgroups. Data for time-to-treatment failure (TTF) according to histology (panel A) or molecular subtypes (panel B) and prediction error curves for TTF in Cox regression models including histology only, molecular classification only, or molecular classification and histology (both) (panel C) are depicted.

