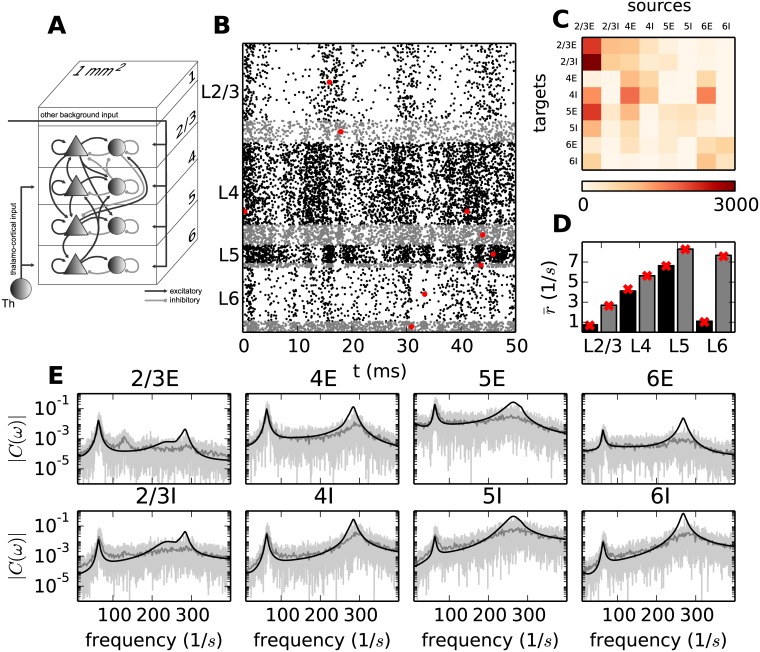
Fig 1. Activity in the microcircuit model.
A Sketch of the layered connectivity structure of the model adapted from Fig 1a of Potjans and Diesmann [34]. B Dot plot marking the spike times of all neurons in a 50 ms segment of a direct simulation of the model in A. Black dots denote spike times of excitatory and gray dots of inhibitory neurons. The red dots mark the firing times of one particular neuron per population. C Average number of indegrees. D Average firing rates of neurons for each population obtained by simulation (black bars: excitatory population, gray bars: inhibitory population) and theoretical predictions (red crosses). E Raw spectra extracted from a simulation of 10 s by the Fast Fourier Transform (FFT) algorithm using a binning of 1 ms (light gray curves) and averaged over 500 ms windows (gray curves) and the analytical prediction (black curves). The top row shows the spectra in the excitatory and the bottom row the spectra in the inhibitory populations.

