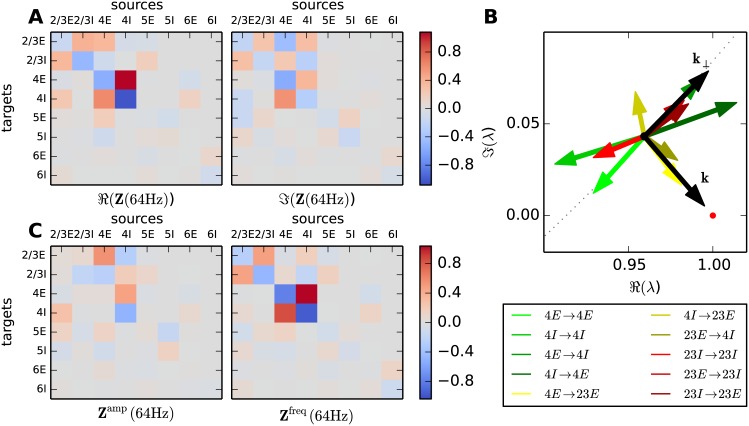
Fig 5. Sensitivity of oscillations to changes in connectivity.
A Real (left panel) and imaginary part (right panel) of the sensitivity measure Eq (7) (color coded; gray: insensitive, red: positive, blue: negative) evaluated at peak frequency 64 Hz. Each matrix element corresponds to one connection in the microcircuit. B A selection of the most prominent matrix elements (legend) of the sensitivity measure at 64 Hz visualized as vectors in the complex plane. The red vectors are associated with connections in layer 2/3, the green vectors with connections in layer 4 and the yellow vectors with the connection between layers 2/3 and 4. The red dot denotes the critical value one. The black vector k starts from the critical eigenvalue and points towards one. The vector k⊥ denotes the direction perpendicular to k. The gray dots mark the trajectory of the critical eigenvalue parameterized by frequency. C Sensitivity measure in rotated coordinates separating the influence of connections on peak amplitude (left panel) and frequency (right panel), otherwise same display as in A.

