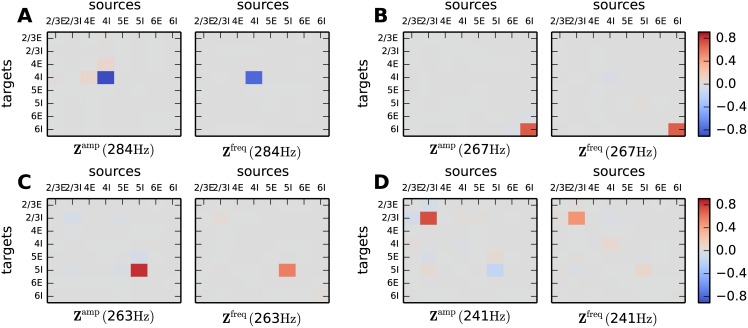
Fig 6. Connections relevant for high frequency oscillations.
Sensitivity measure evaluated at the peak frequency of the four dominant modes in the high-γ regime (A–D). Zamp(ω) visualizes the importance of the connections for the peak amplitude and Zfreq(ω) the importance for the peak frequency. Same display as in Fig 5C.

