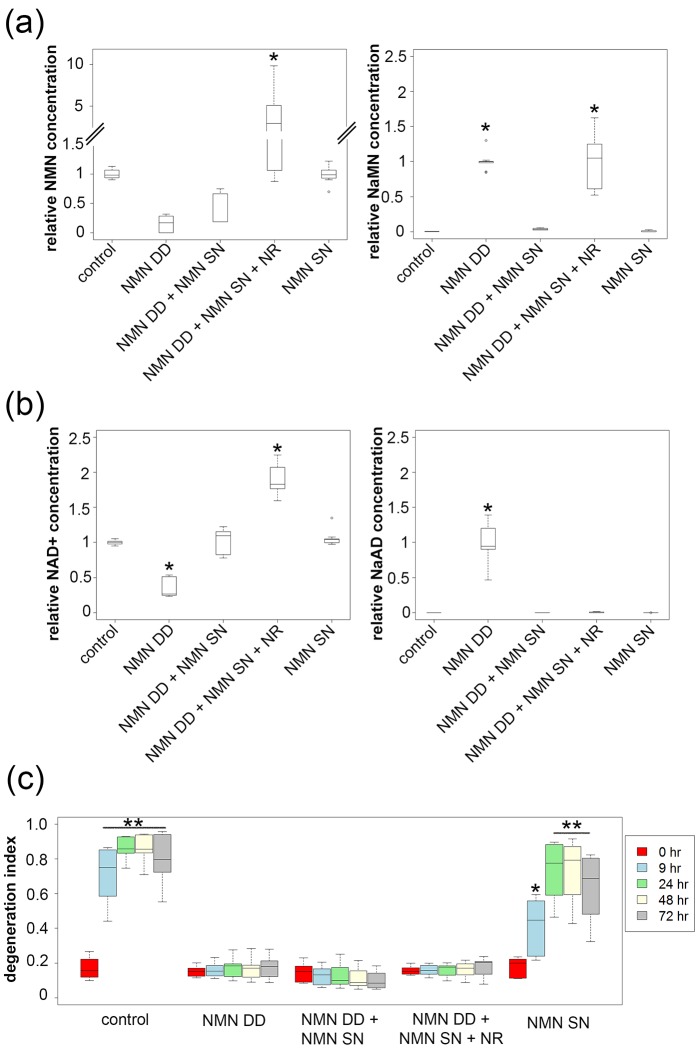
Figure 3. NMN deamidase does not protect axons by reducing NMN levels or by elevating NaMN or NaAD.
(a, b) Metabolites were analyzed from control or NMN deamidase (NMN DD)-expressing neurons. Nicotinic acid mononucleotide (NaMN) and nicotinic acid adenine dinucleotide (NaAD) levels were normalized to those present in NMN DD-expressing neurons. NMN and NAD+ levels were normalized to that of control neurons. Nicotinamide riboside (NR, 5 mM) was added at 24 hr prior to metabolite measurements. Data show the first and third quartile (box height) and median (line in the box) ± 1.5 time interquartile (details in the method), one-way ANOVA (NaMN, F(4, 40) = 71.8, p<2×10–16; NMN, F(4, 40) = 72.69, p=1.64×10⁻⁹; NaAD, F(4,40) = 101.3, p < 2×10–16; NAD+, F (4,40) = 121.4, p < 2 x 10–16). *p <1 × 10⁻¹⁰ denotes significant difference from control (for NMN and NAD+) or NMN DD-expressing (for NaMN or NaAD) metabolite levels with Holm- Bonferroni multiple comparison (Figure 3—source data 1, n = 9). (c) Axon degeneration index (DI) of NMN DD and/or NMN synthetase (NMN SN)-expressing neurons from 0 to 72 hr post axotomy; data show the first and third quartile (box height) and median (line in the box) ± 1.5 time interquartile (details in the method). One-way ANOVA (F(24, 200) = 75.06, p<2 × 10–16. *p<0.002, **p<2 × 10–16denote significant difference from control DI before axotomy (Figure 3—source data 1, n = 9).
DOI: http://dx.doi.org/10.7554/eLife.19749.011

