
Figure 4. SARM1-dependent injury-induced NAD+ consumption in the axon is the critical determinant of axon degeneration.
(a) Axonal NAD+ consumption and synthesis rates were measured by using stable isotope Nam (D4-Nam; 2,4,5,6-deutrium Nam). Culture medium was supplemented with 300 µM of D4-Nam at time 0 and then deuterium-labeled (heavy) NAD+ (to follow synthesis) and non-labeled (light) NAD+ (to follow consumption) were measured from axonal metabolites using LC-MS/MS. Representative graphs of NAD+ synthesis and consumption before and after axotomy in wt and SARM1 KO are shown (mean ± s.d., n=3 for each data point). (b) Quantification of axonal NAD+ consumption rate under various manipulations of NAD+ biosynthesis pathways before and 4 hr after axotomy (NR concentration was 1 mM for cytNMNAT1 and 5 mM for NMN DD NMN SN expressing cells); data show the first and third quartile (box height) and median (line in the box) ± 1.5 time interquartile (details in the method), one-way ANOVA F(13,118) = 17.19 p<2 × 10–16. *p<0.005 denotes significant difference from the NAD+ consumption rate of control before axotomy with Holm-Bonferroni multiple comparison (Figure 4—source data 1, n=9 except NAMPT where n = 12). (c) Fold increase of axonal NAD+ synthesis at 2 hr after axotomy compared with the uncut control under various manipulations of the NAD+ biosynthesis pathway. The NAD+ synthesis rate was normalized to that of corresponding uncut axons; data show the first and third quartile (box height) and median (line in the box) ± 1.5 time interquartile (details in the method), one-way ANOVA F(4, 43) = 21.41, p=9 × 10⁻¹⁰. *p<4 × 10⁻⁵ denotes a significant difference form fold increase of NAD+ synthesis in control with Holm-Bonferroni multiple comparison (Figure 4—source data 1, n=9 except for control where n = 12).
DOI: http://dx.doi.org/10.7554/eLife.19749.013

Figure 4—figure supplement 1. Axonal degeneration profiles after axotomy were not altered by the addition of 1 mM Nam to the culture medium at the time of axotomy (Figure 4—source data 2, n=4).
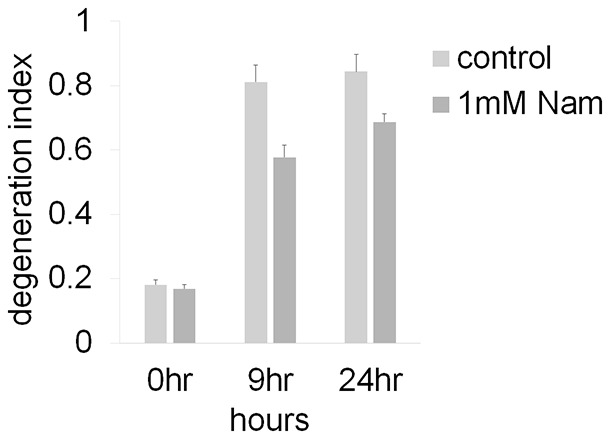
Figure 4—figure supplement 2. Representative NAD+ consumption and synthesis in DRG neurons.
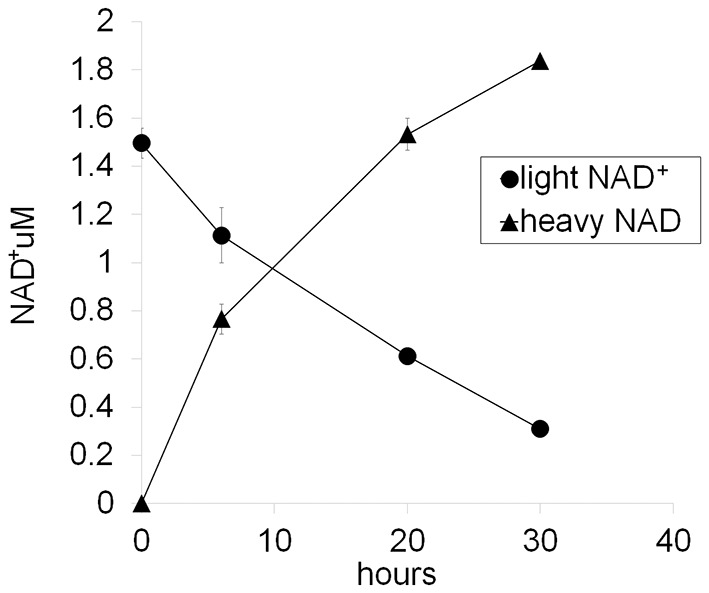
Figure 4—figure supplement 3. Absolute axonal NAD+ consumption rates in neurons expressing various NAD+ biosynthesis enzymes or in control neurons.

Figure 4—figure supplement 4. Representative axonal NAD+ consumption under various manipulations of NAD+ biosynthesis pathways are shown (mean ± s.d., n=3 for each data point).
