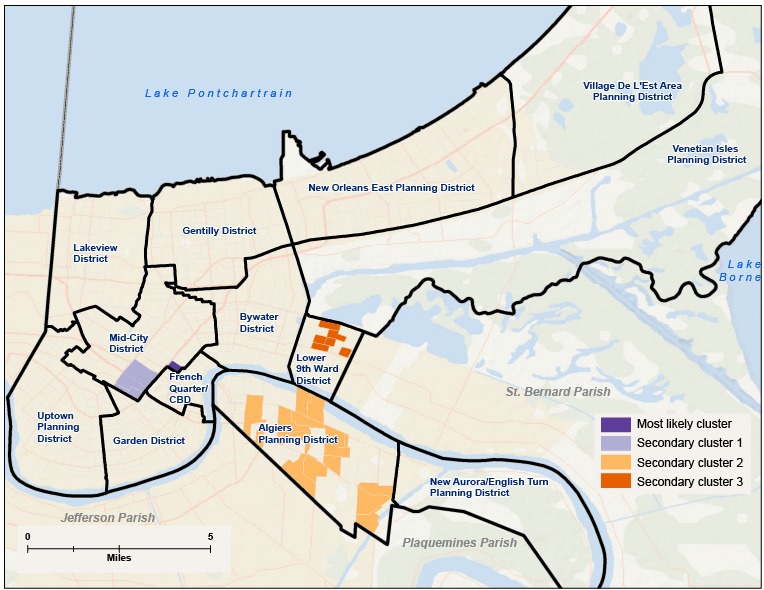
Figure 2.

Clusters of hospitalizations for substance abuse disorders at the block group level calculated by using the discrete Poisson model with sex and age group as covariates, New Orleans, 2008. The most likely cluster was the eastern corner of Mid-City (relative risk [RR], 831.23). The next highest, in order, were the north corner of the Lower 9th Ward (RR = 11.91), Algiers (RR = 0.40), and the southeast corner of Mid-City (RR = 23.38).
