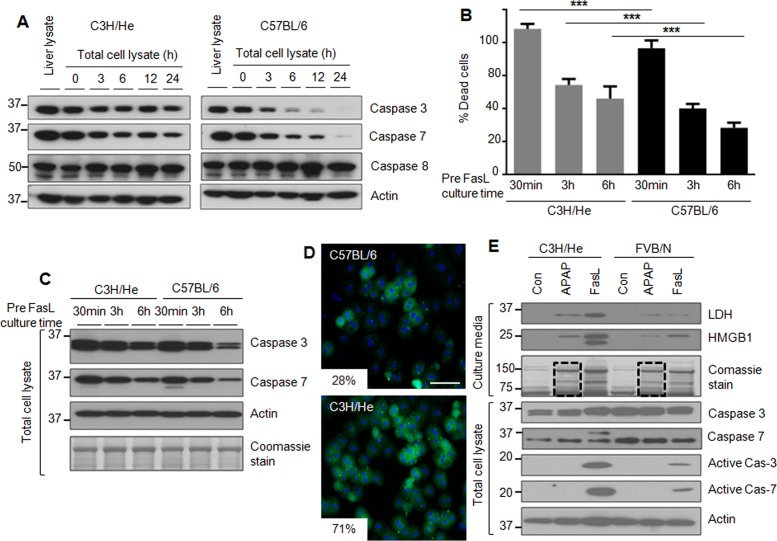
FIGURE 2:
The genetic background alters hepatocyte susceptibility to apoptosis ex vivo. (A) Hepatocytes were isolated from C3H/He and C57BL/6 mice, followed by culture for the indicated times and then blotting of the lysates. A total liver lysate (lane 1 for each strain) is included to show in situ whole-liver protein levels. (B) Hepatocytes were isolated from C3H/He and C57BL/6 mice and then treated with FasL (0.5 μg/ml, 6 h) after the indicated times of culture. The histogram shows percentage of cell death. ***p < 0.001. (C) Hepatocyte lysates were prepared from duplicate cells to those in B, followed by blotting for caspases 3 and 7. An actin blot and Coomassie stain are included to show equal protein loading. (D) Hepatocytes were isolated from C3H/He and C57BL/6 mice and treated with FasL (0.1 μg/ml, 6 h) after 3 h of cell attachment. Apoptotic cells were visualized using annexin-V staining (green), with counterstaining with 4′,6-diamidino-2-phenylindole (DAPI; blue) to visualize nuclei. Percentage mean annexin-V+ cells is shown. p < 0.001; scale bar, 200 μm. (E) Isolated hepatocytes from C3H/He and FVB/N mice were treated with APAP (1 mM) or FasL (0.5 μg/ml, 6h) after 3 h of cell attachment. Concentrated culture medium was analyzed by blotting using antibodies to the indicated antigens. The Coomassie stain of the concentrated culture medium shows the increased release of cellular proteins in the presence of APAP (dashed lines in lanes 2 and 5) and FasL.

