

Abstract
Woodpeckers avoid brain injury while they peck at trees up to 20 Hz with speeds up to 7 m/s, undergoing decelerations up to 1200 g. Along with the head, beak and neck, the hyoid apparatus (tongue bone and associated soft tissues) is subjected to these high impact forces. The shape of the hyoid apparatus is unusual in woodpeckers and its structure and mechanical properties have not been reported in detail. High-resolution X-ray micro-computed tomography and scanning electron microscopy with energy dispersive X-ray spectroscopy were performed and correlated with nanoindentation mapping. The hyoid apparatus has four distinct bone sections, with three joints between these sections. Nanoindentation results on cross-sectional regions of each bone reveal a previously unreported structure consisting of a stiff core and outer, more compliant shell with moduli of up to 27.4 GPa and 8.5 GPa, respectively. The bending resistance is low at the posterior section of the hyoid bones, indicating that this region has a high degree of flexibility to absorb impact. These new structural findings can be applied to further studies on the energy dissipation of the woodpecker during its drumming behavior, and may have implications for the design of engineered impact-absorbing structures.
Keywords: Woodpecker, Tongue, Hyoid bone, X-ray micro-computed tomography, Nanoindentation
1. Introduction
Woodpeckers (family Picidae) are found in forested areas worldwide, except in Australia and surrounding areas. They feed by pecking (tapping or drumming) into wood and using their tongue to extract insects or sap. They have strong tail feathers, which are used as a lever during pecking and zygodactyl feet that help them balance. The extreme conditions during pecking include head speeds up to 7 m/s, a deceleration up to 1200 g and pecking rates of 20 times per second, which occur without sustaining concussions or brain damage [1].
One adaptation in woodpeckers is the unusual structure of its hyoid apparatus [2]. The hyoid apparatus in birds consists of the tongue bones along with associated connective tissues (cartilage, and soft tissues such as muscles, dermis and epidermis). The primary function of the hyoid apparatus is to anchor and allow for the extension of the tongue [3]. However, considering the extreme conditions experienced by the entire head during pecking, this structure must be capable of effectively dissipating energy to avoid failure.
In most birds, the hyoid apparatus consists of five distinct bones: the paraglossal, basihyal, urohyal, paired ceratobranchial, and paired epibranchial (Fig. 1a–c, for a domestic chicken (Gallus gallus)) [3]. Between the different bones, there are joints that provide for the motion required during feeding. In contrast to the chicken, the structure of the hyoid apparatus in a golden-fronted woodpecker (Melanerpes aurifrons, shown in Fig. 1d), is elongated and wraps around the skull from the rostral (toward the beak) to the caudal (toward the terminal end). In the woodpecker the epibranchial bones are much longer than in most other birds (as seen by comparing Fig. 1c and e), terminating in the supraorbital ridge between the orbits (eyes), as opposed to the occipital bone (base of the cranium) [1,4–6]. In Fig. 1c and e, the epibranchial bones make up 37% and 61% of the entire length of the hyoid bones in chickens and woodpeckers, respectively. These measured ratios show that the length of the epibranchial bone in woodpeckers is relatively much longer than in chickens.
Fig. 1.

Bones in chicken and woodpecker hyoid apparatus. (a) Photograph (dorsal view) of the hyoid bones of a domestic chicken (Gallus gallus). Taken from [51]. (b) Schematic diagram of the dorsal view showing the paraglossal, the basihyal, the urohyal bone, and the paired ceratobranchial and epibranchial bones in a domestic chicken. Adapted from [3]. (c) Lateral view of the hyoid bones of a chicken. Adapted from [3]. (d) Lateral view of a golden-fronted woodpecker (Melanerpes aurifrons) skull with the hyoid apparatus colored in red. Taken from [52]. (e) Lateral view of the hyoid bones of a red-bellied woodpecker (Melanerpes carolinus) that highlights the bones and joints. The change in cross-section of the bones along the length is indicated. Adapted from [5]. Note: the epibranchial bone is ~1/3 of the total length of the hyoid bone in chickens, but is ~2/3 of the total length in woodpeckers. Scale bars were not provided in the references for (c) and (e). (For interpretation of the references to color in this figure legend, the reader is referred to the web version of this article.)
The urohyal bone is absent in woodpeckers. Bock [5] found that the hyoid apparatus had a bony core structure, which was surrounded by muscles. Fig. 1e depicts a lateral view, where the bones are identified along with the joints that exist between the paraglossal-basihyal, basihyal-ceratobranchial, and ceratobranchial-epibranchial bones. Bock [5] also described anatomical features (i.e., different cross-sectional shapes of the bones along with their positions), but did not investigate their functional or structural relationships. The structural role and function of the urohyal bone in parrots was briefly introduced by Homberger [7] as an attachment point to support adjacent tissues (larynx, cartilage, ligament and muscle). However, it is unclear why this particular bone is absent in the woodpecker.
The woodpecker’s unique ability to avoid traumatic brain injury has led researchers to investigate energy absorbing mechanisms in its skull. As has been demonstrated for metallic biomaterials [8], investigations of the relationship between structure and mechanical properties can provide insight into the holistic nature of materials. To this end, several anatomical features have been attributed to energy absorption, including a small brain size and mass when compared to surface area, the short impact duration of pecking and the small volume of cranial fluid [1,9,10]. Strong neck muscles provide protection from injury caused by rotational forces [9]. A previous study of the relationship between structure and mechanical properties of the beak of woodpeckers revealed that the lower porosity found in the bony layer strengthens the beak for pecking [11]. In addition, the sponge-like bone structure within the upper beak and the more plate-like cranial bones (both absent in non-pecking birds) may also contribute to the energy absorption [6,9,12]. A quantitative bone morphometry analysis of woodpecker skull bones was conducted by Wang et al. [13], suggesting that this structural parametric analysis might be useful for comparative study of different species of birds. In a comprehensive review paper [14], the mechanisms that provide impact resistance to the woodpecker’s head were discussed, that include woodpecker-inspired shock-absorbing applications. However, information on the hierarchical structure of the hyoid apparatus is not yet understood.
Reports on the potential ability of the hyoid apparatus to withstand impact have focused upon its potential to aid the skull in avoiding brain injuries and have relied upon numerical and finite element analyses [6,12,15–18]. Oda et al. [15] determined that the presence of the hyoid bones may lower the compressive and tensile stresses in the brain up to 40% during pecking. Wang et al. [6] suggested that the three most important factors for shock absorption are: 1) the macro/micro structures of the head, including the hyoid apparatus, 2) the uneven plate-like trabecular bones in the cranium, and 3) the unequal lengths of the upper and lower beak. The hyoid bone was also suggested to play the role of a ‘seat belt’ after impact [6]. Yoon et al. [16] mimicked the head for application in devices that experience high-g and high-frequency mechanical forces by using a simplified mechanical vibration model that simulated the head as a damper and spring. They reported that the woodpecker-inspired shock-absorbing system showed a 1% failure rate at 60,000 g, compared to a hard resin shock-absorbing system, which showed 26% of failure. Zhu et al. [17] performed a numerical study for the impact response of the head and reported that stress waves propagated from the upper bill to the posterior of the skull. It was concluded that the stress wave was decreased by two structural features: 1) having the skull wrapped with the hyoid apparatus and 2) the viscoelastic energy absorption of the biological tissues. In addition, the function of the hyoid bone was computationally assessed by Liu et al. [18] who found that there was 30% less deformation of the whole head with the hyoid bones than without them. They concluded that the hyoid bone and muscle contributed together to increase the rigidity of the whole head, reducing the deformation and oscillation of the skull.
When solely considering the hyoid apparatus, initial mechanical properties were reported and based on tensile tests including both bone and soft tissues [19]. It was determined that the elastic modulus and tensile strength were 1.3 GPa and 76.0 MPa, respectively, at the joint between the paraglossal and basihyal bone [19]. In the epibranchial bone, the elastic modulus and tensile strength were 3.7 GPa and 92.0 MPa at the rostral position and 1.7 GPa and 131.0 MPa in the midsection [19]. The higher modulus and lower strength of the rostral end of the epibranchial bone compared to the midsection were attributed to the amount of soft tissue surrounding the bone. Because the diameter of the hyoid apparatus is relatively constant along the epibranchial bone, it is possible that there is a thinner sheath of soft tissue surrounding the bone at the rostral end and a thicker sheath at the midsection, which would result in an increased bone diameter at the rostral end compared to the midsection.
The interpretation of the results of the previous studies [6,15–19] on the hyoid apparatus used the term “hyoid bone” instead of “hyoid apparatus” (or sometimes “lingual apparatus” [3]). As a result, the previously acquired mechanical properties and numerical simulation results on the “hyoid bone” were based on the properties of bulk hyoid apparatus. Here, we distinguish the difference between the individual hyoid bones and the hyoid apparatus.
The objective of this study is to specifically analyze the morphological and structural features and associated mechanical properties of the hyoid bones of acorn woodpeckers (Melanerpes formicivorus) to examine the structure/mechanical property relationships that allow it to avoid failure during the extreme conditions of pecking. Livingston [2] observed that the woodpecker tongue showed fascinating aspects of adaptable design in nature by linking structure and function. By using sophisticated analytical techniques, the structure of the woodpecker hyoid apparatus can be more accurately assessed. The results of this study have implications for the design of engineered structures, such as impact-absorbing protective headgear for athletes and the military.
2. Experimental
2.1. Sample collection and preparation
This study was conducted under the approval of animal care and use program by Institutional Animal Care and Use Committee (IACUC) at University of California, San Diego (Tissue Permit Number: T14068).
Three adult acorn woodpeckers were donated soon after death from a northern California ranch. These were immediately frozen and kept in a frozen state during transportation to the lab. All samples were stored in a freezer at −20 °C. The woodpeckers were gradually thawed at room temperature for 30 min before performing other tests. All tests were performed under ambient conditions (25 °C, 60% relative humidity)
2.2. X-ray Micro-computed tomography (μ-CT) and three-dimensional reconstruction
The whole birds were scanned by X-ray micro-computed tomography (μ-CT, SkyScan 1076, Bruker microCT, Kontich, Belgium) with a rotation step of 0.7°, an exposure time of 1600 ms, a 100 kV acceleration voltage, and an isotropic voxel size of 36.00 μm. The heads were scanned with an isotropic voxel size of 9.06 μm, while the other scan parameters were the same as for the whole birds. In addition, high-resolution μ-CT (HR-μCT, MicroXCT-200, Xradia, Pleasanton, CA) was used for imaging small pieces (5 mm × 5mm× 2 mm) of each hyoid bone with a 0.916 μm voxel size at a 40 kV acceleration voltage. The rotation angle and tilt increment were 360° and 0.2°, respectively. The images and three-dimensional reconstructed models were developed using the software programs CTvox and Dataviewer (Bruker microCT, Kontich, Belgium) and XMReconstructor (Xradia, Pleasanton, CA). ImageJ software (National Institutes of Health, Bethesda, MD) was used upon orthoslice images of the heads to calculate the cross-sectional area and dimensions of the hyoid bone at varying positions along its length. Each dimension was measured at least six times and the mean values were calculated.
Each hyoid bone was selected for visualization and analyzed using Amira software (FEI Visualization Sciences Group, Burlington, MA). After the reconstruction, cross-sectional dimensions were determined by creating triangle mesh models saving them into the extension format of the virtual reality modeling language.
2.3. Microscopic evaluation and chemical composition
Two birds were thawed for dissection and subsequent excision of the hyoid apparatus. Each was submerged immediately into a 2.5 vol.% glutaraldehyde solution for 24 h for tissue fixation. After that, they were dehydrated in increasing concentrations of ethanol: 30%, 50%, 70%, 90%, and 100% (vol.%) for 10 min each and then dried by a critical point dryer (Autosamdri 815A, Tousimis, Rockville, MD). After the dehydration process, the hyoid apparatus was cut along the transverse and longitudinal planes and divided into several pieces. Two separate sets of samples were prepared for the microstructural analysis and the nanoindentation test from each piece. Samples for the nanoindentation test were embedded in an epoxy resin and cured overnight at room temperature. Embedded samples were cut into smaller pieces using a jeweler’s saw and both sides were polished using a series of SiC paper with average particle sizes of 35 μm and 15.3 μm, followed by fine polishing with an alumina powder media down to 0.05 μm to provide a mirror finish. Optical micrographs were obtained by a light microscope (VHX1000, Keyence, Osaka, Japan) to visualize the color and shape of each tissue without any staining. These samples were used for nanoindentation tests first and then sputter coated with iridum (K575X, Emitech, Fall River, MA) at 85 mA for 10 s. Samples for the microstructural analysis were also coated with iridium without epoxy. Scanning electron microscopy (SEM) and energy dispersive X-ray spectroscopy (EDS) were performed (XL30 UHR-SEM, FEI Company, Hillsboro, OR and Inca, Oxford, Abingdon, Oxfordshire, UK) at 15 keV for the prepared samples individually. Another SEM device (XL30 ESEM, FEI Company, Hillsboro, OR) with a back-scattered electron (BSE) detector was utilized to highlight atomic mass contrast within the tissues. In addition, the elemental composition was acquired from the cross-sections near the nanoindentation sites. The EDS spectra at each indent were obtained at least three times to determine the average and standard deviation.
A dried sample from the lingual apex and body were tested separately as a whole piece by thermogravimetric analysis (TGA) (SDT Q600 TGA, TA Instruments, New Castle, DE) at a ramp rate of 10 °C/min and a range of 20 ~ 600 °C, following a previously reported procedure [20] to determine the amount of water, mineral, and protein. A polished cross-sectional sample of the lingual apex was analyzed by Fourier transform infrared (FTIR) spectroscopy (Equinox 55, Bruker Optics, Billerica, MA). The spectral range was 400–4000 cm−1 with a 4 cm−1 resolution. The scan number was 1024 in reflection mode. The background signal was collected in transmission mode through air.
2.4. Nanoindentation
The hardness and elastic modulus were acquired by nanoindentation (TI 950 TriboIndenter, Hysitron, Minneapolis, MN) with a diamond cube corner tip on polished cross-sectional pieces of four different hyoid bones. Indentation mapping was carried out with displacement controlled indents to a maximum depth of 500 nm. A trapezoidal load function consisting of a 5 s loading segment, a 2 s hold, and a 5 s unloading segment was used. Indents were arranged in square arrays, spaced either 20 or 30 μm apart. A fused quartz standard sample from Hysitron was used to calibrate the tip area function for the diamond cube corner tip. The tests were performed at least ten times for each sample and the average value and standard deviation were calculated. The hardness (H) is given by:
| (1) |
where Pmax is the maximum load (in N) and the Ac is the projected area of the indenter at peak load computed from the area function, Ac = F(hc), where hc is the contact depth [21]. For a cube corner tip indenter, the area function . The slope of the initial unloading load–displacement curve, S = dP/dh, was used to calculate hc:
| (2) |
where hmax is the maximum displacement. The reduced elastic modulus, Er, is given by:
| (3) |
The Young’s modulus, E, was obtained from:
| (4) |
where Ei and vi are the Young’s modulus (1,140 GPa) and Poisson’s ratio (0.07) of the indenter [22] and v is the Poisson’s ratio of the tested sample (taken as 0.3) [23]. The test sites (basihyal, ceratobranchial and epibranchial) for the indentation mapping were determined after confirming the macro/micro structure of these bones and all indents were performed on the transverse crosssections. Details of nanoindentation test specimens are listed in Table 1.
Table 1.
Dimension, shape, and mechanical properties of each of the hyoid bones. See Fig. 5a for bone locations.
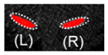
| Bone | Cross-sectional shape (scheme) | Cross-section (μCT, L: left, R: right) | Dimensions (mm) and second moment of area (I) (×10−3 mm4) | Bone type | Number of nanoindentation tests (n) | Young’s modulus E (GPa) | Nanohardness H (GPa) | Area fraction | Bending resistance EcI (×10−8Nm2) | |
|---|---|---|---|---|---|---|---|---|---|---|
| Paraglossal (#1) |
|

|
Length: 5.6 at = 1:04 bt = 0:48 I: 3.19 |
Stiff Compliant |
78 170 |
27.4 ± 6.8 25.1 ± 6.1 |
0.81 ± 0.29 0.67 ± 0.29 |
0.17 0.83 |
8.14 | |
|
| ||||||||||
| Basihyal (#4) |
|

|
Length: 14 ac = 0:37 I: 14.7 |
Stiff Compliant |
35 132 |
19.9 ± 5.0 16.3 ± 3.3 |
0.49 ± 0.14 0.47 ± 0.12 |
0.22 0.78 |
25.12 | |
|
| ||||||||||
| Ceratobranchial (#6) |
|
|
Length: 14 ae = 0:35 be = 0:14 I: 0.75 |
Stiff Compliant |
49 50 |
19.6 ± 3.0 14.2 ± 3.3 |
0.46 ± 0.13 0.36 ± 0.10 |
0.49 0.51 |
1.27 | |
|
| ||||||||||
| Epibranchial 1 (#8) |
|
|
Total length: 28 |
ae = 0:37 be = 0:12 I: 0.50 |
Stiff Compliant |
105 122 |
21.8 ± 3.8 16.3 ± 3.9 |
0.66 ± 0.16 0.51 ± 0.12 |
0.32 0.68 |
0.91 |
| Epibranchial 2 (#10) |

|
ae = 0:45 be = 0:06 I: 0.08 |
Stiff Compliant |
112 83 |
21.7 ± 4.3 18.8 ± 5.4 |
0.43 ± 0.16 0.39 ± 0.15 |
0.30 0.70 |
0.15 | ||
| Epibranchial 3 (#12) |

|
ae = 0:22 be = 0:04 I: 0.01 |
Stiff Compliant |
68 60 |
17.3 ± 3.2 8.5 ± 4.7 |
0.45 ± 0.27 0.27 ± 0.14 |
0.20 0.80 |
0.01 | ||
|
| ||||||||||
| Bovine femur cortical [33] | – | – | – | Cortical bone | 30 | 24.4 ± 2.2 | 0.68 ± 0.10 | – | – | |
|
| ||||||||||
| Bird wing (humerus and ulna) | – | – | – | Cortical bone | – | 27.8 [37] | 0.55 ± 0.15 (microhardness [38]) | – | – | |
|
| ||||||||||
| Woodpecker (beak bones) [11] | – | – | – | Trabecular-like inner bone layer | – | 30.2 ± 3.6 | 1.16 ± 0.19 | – | – | |
|
| ||||||||||
| Great spotted woodpecker [6,50] | – | – | – | Cranial bone | – | 0.3 ± 0.02 [6,50] | ||||
2.5. Statistical analysis
One-way ANOVA analyses were used to identify statistically significant differences of the Young’s moduli and hardness among the different hyoid bones [24]. In addition, a multiple comparison test was conducted by Tukey’s least significant difference procedure, which is valid if the preliminary test (the one-way ANOVA F-test) shows a significant difference [25]. A paired sample t-test was used to compare statistically significant differences of the Young’s moduli and hardness between the two different bone regions for each hyoid bone. The criterion for statistical significance was p < 0.05 for both the ANOVA and the t-test.
3. Results and discussion
3.1. Macroscale structure
Fig. 2a shows a photograph of an acorn woodpecker with an overall length and width of ~216 × 51 mm and a head length, width and height of 57.8 × 15.4 × 27.9 mm. Fig. 2b shows a photograph of the dissected hyoid apparatus. The hyoid apparatus is composed of four different regions: the lingual apex, lingual body, lingual root, and hyoid horns, which are connected along its sagittal plane from rostral to caudal positions [26]. The paraglossal and basihyal bones are located inside the lingual apex and body, respectively. The caudal end of basihyal bone, the rostral end of ceratobranchial bones, and their connecting joint are located at the lingual root. The hyoid horns contain the ceratobranchial and epibranchial bones along with their joint. Fig. 2c shows dried and sectioned pieces that were used for further analysis. The barbed tips at the lingual apex are clearly visible in Fig. 2b and c (black). The lingual body has the largest diameter. Fig. 2d–f show the magnified images of the interfaces between the lingual apex and body (Fig. 2d), the lingual body and root (Fig. 2e), and the lingual root and hyoid horn (Fig. 2f), which surround the three joints in the hyoid apparatus.
Fig. 2.

(a) Photograph of an acorn woodpecker. (b) The dissected hyoid apparatus. (c) The dried and sectioned samples of the hyoid apparatus in transverse and longitudinal planes. Magnified photographs of the three joint locations in the hyoid apparatus between (d) the lingual apex and body, (e) the lingual body and root, and (f) the lingual root and the hyoid horn.
Fig. 3 shows μ-CT reconstructed images of the head. The hyoid bone wraps around the head, from the rostral end at the beak to the supraorbital ridge between the two orbits. Some woodpeckers with long probing tongues have even more elongated hyoid horns that can pass through the right nasal cavity and upper jaw (as is the case for the European woodpecker (Picus viridis)) or can circle the right orbital bone (as is the case for the North American hairy woodpecker (Picoides villosus)) [5]. The acorn woodpecker’s hyoid horns are less elongated than these two species, which is likely due to a specialization for either drilling or probing functions [5].
Fig. 3.

Micro-computed tomography images of the head structure of an acorn woodpecker at different orientations. (a) Left lateral view, (b) dorsal view, (c) ventral view, and (d) lateral view of the hyoid bones. A color scale is shown to indicate the gradient in color (that is associated with mineral density) from the highest density in red to lowest density in dark blue. This shows that the hyoid bones are relatively denser than the skull. (For interpretation of the references to color in this figure legend, the reader is referred to the web version of this article.)
The color distribution in Fig. 3 reflects the X-ray intensity profile based on the normalized material density, ranging from the highest density (red), middle-range density (higher → lower: yellow → green → light blue) to the lowest density (dark blue). The density is correlated with the amount of mineral: red having the highest mineral content and dark blue having the lowest. Fig. 3a illustrates that the inner part of the upper (maxilla) and lower (mandible) beak showing the highest mineralized area, which are the bones in the beak. The hyoid bones show mid-range of densities (Fig. 3a–d). The skull and orbital bones have low to midrange densities (Fig. 3a–c). An interesting point is that the beak and hyoid bones have a higher mineral density than the cranial bones. The beak bone is more mineralized, which should lead to a relative increase in strength and stiffness. This could be to reinforce the beak and hyoid apparatus during the impacts from pecking. The mineral density of the hyoid bones varies along their sagittal plane, having slightly higher mineral density in the paraglossal and ceratobranchial bones than in the basihyal and epibranchial bones. X-ray transparent regions are found between the bones, indicating the presence of soft material in the joints; these observations are discussed later.
3.2. Microscale structure
The four main components of the hyoid bone are shown in Fig. 4a(A–D) reconstructed from the μ-CT images and colorized for better visualization. At the interfaces of the four components, there are three joints (E–G). The paraglossal bone (A in Fig. 4a, yellow) is in the lingual apex, the basihyal bone (B in Fig. 4a, blue) is in lingual body, and the ceratobranchial bone (C in Fig. 4a, green) is near lingual root. The epibranchial bone (D in Fig. 4a, red) is connected to the ceratobranchial bone. The shape of the rostral part of the paraglossal bone appears to have a saddle-like structure. It also has a small elliptical hole (0.5 × 0.8 mm) in the caudal end. The hole in the paraglossal bone has been suggested as a pathway for a gland that secretes a sticky mucous, which is used as a glue to capture insects (Fig. 4b) [5].
Fig. 4.

Micro-computed tomography images of the hyoid apparatus of an acorn woodpecker, colored for clarity. (a) Left lateral view segmented 3D models. A: paraglossal bone (yellow), B: basihyal bone (blue), C: ceratobranchial bone (green), D: epibranchial bone (red), E: Saddle-shaped joint, F: Y-shaped joint, and G: Circular joint. (b) Expanded view (dorsal, lateral and ventral) of the three joints showing that each has a distinct structure associated with different articulations and functions. (For interpretation of the references to color in this figure legend, the reader is referred to the web version of this article.)
In general, the structure of a joint determines the direction and distance of movement [27]. Joint E (Fig. 4b) is located between the paraglossal and basihyal bones. Bock [5] suggested that this saddle-shaped joint maximizes rotational movement of the tip of the tongue with a wide angle, allowing the paraglossal bone to move in various directions relative to the basihyal bone. The basihyal bone is connected with a Y-shaped joint (F in Fig. 4b) to the two ceratobranchial bones. Each branch reaches the third joint (G in Fig. 4b), which connects to the epibranchial bone. The morphology of the Y-shaped joint (F in Fig. 4b) suggests that it can facilitate rotation in a single plane. The third joint (G in Fig. 4b) appears circular, indicating that it may be more movable compared to the joints E and F since it does not have axial constraints.
Comparing the joints of the hyoid apparatus to the well-studied joints in human anatomy allows for better understanding of their articulation. The saddle-shaped joint (E) can be considered as a biaxial joint, which in humans consists of articulating concave and convex surfaces [27]. Joint E has a similar shape to the human metacarpal joint, which is movable in two planes (sagittal and frontal), suggesting the motion of joint E will be protraction and retraction along the sagittal plane, allowing for circular movement. The Y-shaped joint (F) is similar to a uniaxial pivot joint between the atlas vertebra in humans where motion is limited only to rotation in a single plane [27]. The third circular joint (G) is similar to the hip joint in humans, allowing multi-axial movement [27].
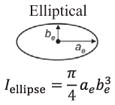
Fig. 5a shows orthoslice images superimposed upon the reconstructed 3D model from μ-CT data of the hyoid bone along the long axis. The three joints are excluded because of their complex structure and shape. The cross-sectional area was calculated for the solid bony parts. Fig. 5b shows a plot of the cross-sectional area as a function of position. The plot represents two types of measurements: the cross-sectional area of a single bone (solid-filled symbols) and the summed areas (empty symbols) that incorporate both segments of the ceratobranchial and epibranchial branches. The measured cross-sectional area increases from the paraglossal bone (#1) to the basihyal bone (#2–#3), then decreases through the basihyal bone (#4), ceratobranchial (#5–#7) and epibranchial (#8–13) bones. The cross-sectional shape of the paraglossal bone (#1) is an inverted isosceles triangle (in Fig. 5a #1, yellow) but becomes more circular in the basihyal bone (#2–#4, blue), which has largest cross-sectional area as a single bone. The ceratobranchial bone is elliptical (#5–#7) and is roughly uniform in shape and cross-sectional area along its length, with an aspect ratio of 2.50. The epibranchial bone has a flattened elliptical cross-section (#8–#13) with an elongated length up to 28 mm (Table 1). The rostral end of the epibranchial bone (#8) has a larger cross-sectional area (1.87 × 10⁻² mm2 and aspect ratio 3.89) compared to the one on the superior positions of the cranium (0.62 × 10⁻² mm2 and aspect ratio 1.70) (#13). These results generally corroborate those of Bock [5] (Fig. 1e), who found the bone gradually changes from thick and less flattened at the rostral end to thin and flattened at the caudal end; however, in the present work, the aspect ratio of the extreme end in the caudal direction (#13) is smaller than the other two locations in the epibranchial bone.
Fig. 5.

(a) Orthoslice images of the hyoid bone with reconstructed 3D models from micro-computed tomography data. (b) Plot of the measured cross-sectional area at each location. (c) Transverse cross-sectional images at each location showing the shape of hyoid bone along its length. Scale bar: 500 μm.
Another interesting observation is that the two neighboring bones that are linked by a joint, have similar cross-sectional areas. The caudal end of the basihyal bone (#4) and the summed area of the rostral end of the ceratobranchial bones (#5) as well as the region between the caudal end of the ceratobranchial bone (#7) and the rostral end of the epibranchial bone (#8) have similar cross-sectional areas. These results suggest that the bone mass or cross-sectional area is maintained through the joint. This is a new observation that suggests that stress discontinuities are prevented across the various joints.
Fig. 6 shows SEM micrographs of the dorsal surface and cross-section of the lingual apex with the corresponding EDS and FTIR spectra. Fig. 6a is a photograph of the lingual apex indicating the viewed locations in Figs. 6b, c, e, and f. The lingual apex has barbed tips (Fig. 6b) and at higher magnification (Fig. 6c) a scale-like structure is observed with scale diameters between 30 and 40 μm (white dotted lines). The EDS spectrum (Fig. 6d) indicates the presence of sulfur, phosphorus, and oxygen. Carbon and nitrogen peaks are not labeled and excluded for quantification results due to the relatively high intensity of the carbon peak and low intensity of the nitrogen peak compared to the other elements (S, P, O, and Ca). The chemical composition (mainly P and S) is similar to that reported for the keratin in the woodpecker’s beak [11]. This, coupled with the SEM images, indicates that the lingual apex has a keratin outer sheath that surrounds the paraglossal bone, as is found in other birds [26]. The cross-section of the lingual apex (Figs. 6e and f) shows that the lingual apex has two distinct layers: a keratin sheath (K) at the surface and a central bone (PG, paraglossal bone) that has some surrounding void areas, likely generated by the dehydration process. The keratin sheath shows a layered structure composed of scales (Fig. 6f). The presence of S is due to S-containing cysteine groups found in keratin. The presence of P in the keratin might be related to a strengthening effect, known as phosphorylation, of the keratin filaments at the cellular level [28]. As shown in Fig. 6g, FTIR spectrum of the cross-section of the lingual apex exhibits a peak near 950 cm−1, a known band for phosphorylated proteins [29]. Also present are the typical peaks of keratin near 1600–1700 cm−1 (amide I), 1550 cm−1 (amide II), and 1200–1300 cm−1 (amide III) [29].
Fig. 6.

(a) Photograph of dissected hyoid apparatus highlighting the imaged locations on the lingual apex. Scanning electron micrographs on the dorsal surface, (b) low magnification and (c) high magnification with the outline of two keratin scales (white dotted lines), and (d) energy dispersive X-ray spectroscopy results. Scanning electron micrographs on the cross-section, (e) low magnification and (f) high magnification. (g) Fourier transform infrared spectrum of the polished sample near the region shown in (f). PG: paraglossal bone, K: keratin scales.
Fig. 7a provides an overview of observed regions in Fig. 7b–j. In Fig. 7b and c, a similar scale-like structure is observed on the lingual body. The EDS spectrum of the cross-section of the lingual body (Fig. 7d) is similar to the lingual apex (Fig. 6d), indicating that it is keratin. As shown in Fig. 7e, the longitudinal-section image of the lingual body illustrates a similar structure to the cross-sectional structure of the lingual apex. Some bundles of fibers are observed near the center part of the basihyal bone (Fig. 7f and g). The fibers are ~194 nm in diameter and >10 μm in length, comparable to mineralized collagen fibril bundles found in the bony core of woodpecker’s beak [11]. Overall, the multilayered structure of the lingual body is similar to the lingual apex. In the dorsal view, the shape and dimension of the keratin scales in both the lingual apex and body have isotropic shapes, which are comparable to the keratin scales on beaks of other birds [30–32], in contrast to the elongated scales found on woodpecker beaks [11]. Fig. 7h shows a SEM image and Fig. 7i (from BH, basihyal bone) and 7j (from M, muscle tissues) show EDS spectra of the cross-sections of the lingual body. In Fig. 7h, the outer region is covered with the dermis (D) and epidermis (ED). The ratio of calcium to phosphorus (Ca/P) is 1.56, which is lower than stoichiometric hydroxyapatite (1.67) [33]. In the central region, there are four muscle tissues, a connective tissue (CT) [26], and a bone core (BH, approximately 500 μm in diameter). The EDS spectrum of the basihyal bone (Fig. 7i), obtained from the central region of the bone confirms the presence of calcium, phosphorus, and oxygen. The average Ca/P of all hyoid bones was 1.50 ± 0.10. In comparison, the average ratio of adult chicken cortical bone (1.73 [34]) and bovine femur (2.23–2.31 [33]) are larger than in the hyoid bones. However, the Ca/P is within the range reported for other animal bones [35]. The strength of synthetic hydroxyapatite increases with increasing Ca/P ratios up to ~1.67, then decreases [36], which implies that the hyoid bones may not be as strong or stiff as other skeletal bones. Because of the homogeneous distribution of the main mineral elements (Ca and P), the effect of chemical composition on the mechanical properties is suggested to be minor compared to the effect of the microstructure, such as pore size and porosity. The EDS spectrum of muscle tissues presents only phosphorus (muscles have a large amount of adenosine triphosphates), without any sulfur or oxygen, as shown in Fig. 7j. The absence of the oxygen peak might be due to dehydration during the sample preparation. In summary, cross- and longitudinal-sections of SEM micrographs and EDS analysis show a multilayer structure with a keratin sheath on the surface of the lingual apex and body and a central bony core in the lingual body that is surrounded by soft tissue. Due to the similarity of the microstructure and chemical composition between the lingual body, the lingual root and the hyoid horn, the latter two are not presented here. TGA analysis found organic to mineral ratios of 0.84:1 for the lingual apex and 1.63:1 for the lingual body, indicating a higher density structure is found within the lingual apex (where the tongue makes contact with trees and prey) as compared to the lingual body.
Fig. 7.

(a) Photograph of dissected hyoid apparatus highlighting the imaged locations on the lingual body. (b–c) Scanning electron micrographs and (d) energy dispersive X-ray spectroscopy result of the dorsal surface. Scanning electron micrographs (e–g) on the longitudinal-section and (h) on the cross-section displaying four different muscles (M) surrounding the basihyal bone (BH). (i–j) Energy dispersive X-ray spectroscopy results of the center of the BH bone and the muscles, respectively. CT: connective tissue, D: dermis.
3.3. Nanoindentation
The mechanical properties of different regions of bones were determined using nanoindentation mapping (Figs. 8 and 9 and Table 1). Optical micrographs of cross-sections of the basihyal, ceratobranchial and epibranchial bones (Fig. 8a, c and e) highlight two different bony regions. In Fig. 5c (#1), the paraglossal bone has a triangle shape and large void area in the center, which interfere the continuous nanoindentation mapping. We had to select and discretize different areas to carry out the mapping and the E maps did not provide enough data compared to the other samples shown in Fig. 8. Therefore, we made a decision to exclude the paraglossal bone and focus on the most representative results. The outer region between the white-dotted and black-dotted lines has a brighter contrast than the inner region enclosed in the black-dotted line. BSE micrographs (Fig. 8b, d and f) taken after nanoindentation and subsequent dehydration show different microstructures in two regions in the magnified micrographs (Fig. 8g and h). The outer regions have a higher density of elliptically shaped pores (3 ~ 9%) than the inner region, each with a major axis ~7.50 μm and a minor axis ~2.30 μm. The cracks in the BSE micrographs were generated during dehydration in the vacuum chamber and are mainly distributed within the inner/stiff bone.
Fig. 8.

Cross-sectional images of the basihyal (BH), ceratobranchial (CB), epibranchial (EB) bones: (a, c, e) Optical micrographs (OM) of each bone, (b, d, f) back-scattered electron (BSE) micrographs with (g, h) the magnified images of the CB bone, and (i, j, k), nanoindentation (Young’s modulus, E) maps overlaid on schematic illustrations of bone regions. The indentation sites for each hyoid bone are shown in Fig. 5a (BH: #4, CB: #6, and EB: #12). A color scale shows the gradient in E from the highest value (35 GPa) in red to the lowest value in blue (0 GPa). In the schematic illustrations (i, j, k), gray denotes the area of soft tissue/epoxy resin, white regions are the stiffer bone and the dash-filled regions are the more compliant bone. The optical micrographs were acquired prior to nanoindentation tests while the BSE micrographs (b, d, f) were obtained after the indentation tests. Note that BSE micrographs are not sensitive enough to image small nanoindentation topography features (~400 nm). The cracks appeared under the high vacuum condition in the scanning electron microscope and were not present during nanoindentation. (For interpretation of the references to color in this figure legend, the reader is referred to the web version of this article.)
Fig. 9.

Bar charts of (a) the Young’s modulus and (b) hardness of each bone. The solid-filled bars represent the average value of the stiff bone region and the dash-filled bars represent the average value of the compliant bone region. PG: paraglossal bone (yellow). BH: basihyal bone (blue). CB: ceratobranchial bone (green). EB-1 to EB-3: epibranchial bone (red). The indentation sites for each hyoid bone are shown in Fig. 5a (PG: #1, BH: #4, CB: #6, EB-1: #8, EB-2: #10, and EB-3: #12). For both the one-way ANOVA and t-tests, comparisons where no statistically significant difference was found are marked with an “ns” symbol. (For interpretation of the references to color in this figure legend, the reader is referred to the web version of this article.)
Based on the contrast difference, schematic illustrations are shown with three simplified features (Fig. 8i, j and k): soft tissue/epoxy resin (gray), the light region between the black-dotted outline and the white-dotted outline (black dashed) and the dark region inside of the black-dotted outline (white). Nanoindentation mapping results distinguish two bone regions (termed “stiff” and “compliant”), which are overlaid on the illustrations. The cross-sectional areas for indentation (basihyal, #4; ceratobranchial, #6; epibranchial, #12) are indicated in Fig. 5a. The small pores (Fig. 8h) have similar dimensions as osteocyte lacuna found in skeletal bird bones (~10 μm) [37,38]. The inner regions are populated with larger, circular pores with diameters of 8–20 μm (Fig. 8g). The larger pores have similar dimensions to vascular channels found in skeletal bird bones (~25 μm) [37,38] but it is unclear if vascularization is present. When considering energy absorbance, this porous and compliant bone can be considered to be a cellular structural design element, which are found throughout nature and are known to be effective at increasing energy absorbance [39].
The average E and H values, the standard deviation, and the number of indentation tests for each specimen are listed in Table 1. The average E (and H) of each hyoid bone ranged from ~17 to 27 GPa (0.4–0.8 GPa) for the inner bone and from ~9 to 25 GPa (0.3–0.7 GPa) for the outer bone (Fig. 9a and b), indicating the bones consist of an outer, more compliant region and an inner, more stiff region. According to statistical analyses using a t-test between the stiff and compliant bones, the E values of the inner region are significantly higher (p < 0.05, Fig. 9a) than the outer region in all of the bones. The stiffer bone always has a higher average E when compared to the compliant bone, ranging from a slight increase in the paraglossal bone to a two-fold increase in the epibranchial bone. Unlike E, a few of the comparisons between the stiff and compliant bone for H were found to exhibit no statistically significant differences. However, these cases (BH and EB-2) can be explained by the fact that H is dependent upon not only elastic deformation (as is the case for E), but also plastic deformation, which is generally considered to be more variable. These bone structures are unlike most other bone, where a dense outer sheath surrounds a less dense core, such as with mammalian skeletal bones. It is unclear what, if any, mechanical advantage this arrangement has in the hyoid bones. However, it can be speculated that a more compliant shell could protect the stiffer, more brittle core.
From Fig. 8b, d and f, the average pore size (major axis, a, and minor axis, b) in the compliant bone is larger in the epibranchial (a ≈ 7.50 μm and b ≈ 2.30 μm) compared to the basihyal (a ≈ 6.30 μm and b ≈ 2.90 μm) or ceratobranchial (a ≈ 5.50 μm and b ≈ 2.00 μm) bones, which reduces the average E. Among the hyoid bones, the paraglossal bone had the highest E and H values, up to three times greater than the epibranchial bone for both the stiff and compliant regions, which corroborates the μ-CT results in Fig. 3 that show a higher mineral density at the rostral position. The E values of the basihyal and ceratobranchial bones as well as the rostral end (EB-1) and midsection (EB-2) of the epibranchial bones are not significantly different (labeled as ‘ns’ in Fig. 9a) for both stiff and compliant regions. In the epibranchial bone, EB-3 has a significantly lower E value than EB-1 and EB-2, as well as the other bones.
Previously reported values of Young’s modulus obtained from tensile tests of the hyoid apparatus near the first joint were 1.3 GPa [19], which show a large deviation from the present result on the basihyal bone. The main reason for this discrepancy is that, in the previous work, tests were conducted on specimens that included the joints (with soft tissues), which would significantly reduce the measured modulus. Other test locations on the two positions of the epibranchial bone (E ~1.7–3.7 GPa) [19], showed a similar discrepancy in E to the present study. This discrepancy might be due to the difference in testing methods (tensile test, indentation test), the proportion of hard and soft tissues as well as different levels of hydration in specimens. It is well known that nanoindentation results on dehydrated samples may result in an increase of up to 20% of Young’s modulus and hardness when compared to hydrated samples [40]. To perform nanoindentation map, however, the samples must be polished to a mirror finish, therefore they must be dehydrated first. Nanoindentation on dehydrated samples is a common technique to investigate the mechanical properties of bone [41,42] and biological materials [43].
For comparison (Table 1), E and H values for bovine femur cortical bone measured by nanoindentation methods are 24.4 GPa and 0.68 GPa, respectively [40]. The E and H of bird wing bones are 27.8 GPa (bending and tension) [44] and 0.55 GPa (Vickers hardness) [38], respectively. The E and H of beak bones from a woodpecker are 30.2 GPa and 1.16 GPa (nanoindentation), respectively [11]. In comparison with the above, the E and H of the hyoid bones are close to the values of the bird skeletal bones. The E and H values depend on structural features, such as porosity and proportion of organic materials [45,46]. Since there are no reported mechanical properties for the other bird hyoid bones, further comparative analysis cannot be made.
3.4. Structure–mechanical properties relationship
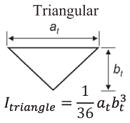
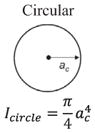
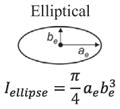
Structural shape is an important factor in the bending resistance, EI, where I is the second moment of area [11,47]. Along the length of the hyoid bones, the term (I) changes along with the observed shapes: triangular, to circular, and finally to elliptical:
| (5) |
| (6) |
| (7) |
where at = base and bt = height for the triangle, ac = radius for the circle and ae = major axis and be = minor axis for the ellipse. From Eqs. (5)–(7), I varies along the length, from the triangular paraglossal (3.19 × 10⁻³ mm4) through the circular basihyal (14.7 × 10⁻³ mm4) to the elliptical ceratobranchial (0.75 × 10⁻³ mm4) and epibranchial (0.01–0.50 × 10⁻³ mm4) bones (Table 1).
Because the bones consist of two regions with different Young’s moduli, a volume fraction rule-of-mixtures was used to calculate the bending resistance of each bone (stiff and compliant regions) [48]. For simplicity, it was assumed that the diameter of each bone was the same along its length, so the area fraction (A) was used instead of the volume fraction. The area fractions of the stiff (Astiff) and compliant (Acompliant) bone regions were measured from the cross-sectional images of optical micrographs (Table 1). Astiff is ~0.2 in the paraglossal and basihyal bones, ~0.5 in the ceratobranchial bone and 0.2–0.3 in the epibranchial bones. The composite Young’s modulus (Ec) is given as:
| (8) |
As shown in Table 1, the bending resistance of the composite bone (EcI) increases from the paraglossal bone to a maximum in the basihyal bone (25.12 × 10⁻⁸Nm2). It then greatly decreases through the ceratobranchial to a minimum at the caudal end of the epibranchial bones (0.01 × 10⁻⁸Nm2). The hyoid bones can be modeled as a flat spiral spring, where the angular deflection is proportional to (EcI)−1. This indicates that the epibranchial bones can undergo substantial deflection compared to the paraglossal and basihyal bones; the latter need sufficient stiffness for excavating insects from trees. Since the flat spiral spring is used to store elastic energy [49], this shape is possibly related to previous statements of Oda et al. [15] and Zhou et al. [19] that the hyoid bones play a role as a shock-absorber or a damper during pecking.
4. Conclusions
Macro- and micro-structural analysis of acorn woodpecker’s (Melanerpes formicivorus) hyoid apparatus and hyoid bones were investigated by a multiscale structural analysis and mechanical property evaluation. The main findings are:
The first hyoid bone/joint 3D model was successfully developed using micro-computed tomography image analysis and used for quantitative analysis of cross-sectional area and shape change of the hyoid bones along their lengths.
Scanning electron microscopy and energy dispersive X-ray spectroscopy on the lingual apex and body reveal a multilayered structure with a keratin sheath on the lingual apex and body and a central bony core in the lingual body.
Electron energy dispersive X-ray analysis showed that Ca/P ratio of all hyoid bones averaged 1.5, a slightly lower ratio than for skeletal bird bones (1.7) [34].
Nanoindentation results show that all hyoid bone cross-sections consist of a dense/stiff interior region surrounded by a porous/compliant region. This compliant region may be effective at dissipating energy in the hyoid bones during pecking.
For the Young’s modulus, the paraglossal bone has the highest value, comparable to the inner bony part of the beak. The basihyal and ceratobranchial bones have similar values, but are lower compared to the paraglossal bone. The epibranchial bone exhibited properties that varied from the highest at the rostral to the lowest at the caudal.
Statement of Significance.
Woodpeckers avoid brain injury while they peck at trees, which results in extreme impact conditions. One common adaptation in woodpeckers is the unusual shape of the elongated tongue, also called the hyoid apparatus. The relationship between the structure and mechanical properties of the bony part of the hyoid apparatus has not been previously reported. A three dimensional model of the bony tongue was developed, and the hardness and stiffness were evaluated. A new type of bone structure, which is opposite of typical skeletal bone structure was found. The combined microstructural and mechanical property analysis indicate possible energy absorption routes for the hyoid apparatus and are applicable to the design of engineered structures.
Acknowledgments
The authors thank to the Mr. and Ms. Sherman for providing the woodpecker specimens and Ms. Esther Cory and Dr. Robert L. Sah for μ-CT scans. This work is supported by an Academic Senate Bridge Grant (2013–2014) and a National Science Foundation, Biomaterials Grant 1507978 (J.M.) and a Multi-University Research Initiative through the Air Force Office of Scientific Research (AFOSR-FA9550-15-1-0009) (J.J., D.K., J.M., S.E.N., V.R.S., N.Y., S. H.). Some of the work described here was carried out using shared research resources at the National Center for Microscopy and Imaging Research (NCMIR) at UCSD supported by the NIH under award number P41 GM103412 (M.H.E.).
References
- 1.May PA, Fuster JM, Haber J, Hirschman A. Woodpecker drilling behavior: An endorsement of the rotational theory of impact brain injury. Arch Neurol. 1979;36:370–373. doi: 10.1001/archneur.1979.00500420080011. [DOI] [PubMed] [Google Scholar]
- 2.Livingston R. Some observations on the natural history of the tongue. Ann R Coll Surg Engl. 1956;19:185. [PMC free article] [PubMed] [Google Scholar]
- 3.Homberger DG, Meyers RA. Morphology of the lingual apparatus of the domestic chicken, Gallus gallus, with special attention to the structure of the fasciae. Am J Anat. 1989;186:217–257. doi: 10.1002/aja.1001860302. [DOI] [PubMed] [Google Scholar]
- 4.Wallace RA. Aberrations in tongue structure of some malanerpine woodpeckers. Wilson Bull. 1974;86:79–82. [Google Scholar]
- 5.Bock WJ. Functional and evolutionary morphology of woodpeckers. Ostrich. 1999;70:23–31. [Google Scholar]
- 6.Wang L, Cheung JTM, Pu F, Li D, Zhang M, Fan Y. Why do woodpeckers resist head impact injury: a biomechanical Investigation. PLoS One. 2011;6:e26490. doi: 10.1371/journal.pone.0026490. [DOI] [PMC free article] [PubMed] [Google Scholar]
- 7.Homberger D. The lingual apparatus of the African grey parrot, Psittacus erithacus Linne (Aves: Psittacidae): Description and Theoretical Mechanical Analysis. Wilson Bull. 1987;99:738–740. [Google Scholar]
- 8.Nag S, Banerjee R, Fraser HL. A novel combinatorial approach for understanding microstructural evolution and its relationship to mechanical properties in metallic biomaterials. Acta Biomater. 2007;3:369–376. doi: 10.1016/j.actbio.2006.08.005. [DOI] [PubMed] [Google Scholar]
- 9.May PA, Fuster J, Newman P, Hirschman A. Woodpeckers and head injury. Lancet. 1976;307:1347–1348. doi: 10.1016/s0140-6736(76)92675-1. [DOI] [PubMed] [Google Scholar]
- 10.Gibson LJ. Woodpecker pecking: how woodpeckers avoid brain injury. J Zool. 2006;270:462–465. [Google Scholar]
- 11.Lee N, Horstemeyer MF, Rhee H, Nabors B, Liao J, Williams LN. Hierarchical multiscale structure-property relationships of the red-bellied woodpecker (Melanerpes carolinus) beak. J R Soc Interface. 2014;11:20140274. doi: 10.1098/rsif.2014.0274. [DOI] [PMC free article] [PubMed] [Google Scholar]
- 12.Wang L, Fan Y. Role of mechanical performance of cranial bone in impact protection of woodpecker brain-a finite element study. World Congress on Medical Physics and Biomedical Engineering, IFMBE Proceedings. 2013;39:165–167. [Google Scholar]
- 13.Wang L, Niu X, Ni Y, Xu P, Liu X, Lu S, Zhang M, Fan Y. Effect of microstructure of spongy bone in different parts of woodpecker’s skull on resistance to impact injury. J Nanomater. 2013;2013:17. [Google Scholar]
- 14.Wang L, Lu S, Liu X, Niu X, Wang C, Ni Y, Zhao M, Feng C, Zhang M, Fan Y. Biomechanism of impact resistance in the woodpecker’s head and its application. Sci China Life Sci. 2013;56:715–719. doi: 10.1007/s11427-013-4523-z. [DOI] [PubMed] [Google Scholar]
- 15.Oda J, Sakamoto J, Sakano K. Mechanical evaluation of the skeletal structure and tissue of the woodpecker and its shock absorbing system. J Soc Mech Eng Int J Ser A: Solid Mech Mater Eng. 2006;49:390–396. [Google Scholar]
- 16.Yoon S-H, Park S. A mechanical analysis of woodpecker drumming and its application to shock-absorbing systems. Bioinspiration Biomimetics. 2011;6:016003. doi: 10.1088/1748-3182/6/1/016003. [DOI] [PubMed] [Google Scholar]
- 17.Zhu ZD, Ma GJ, Wu CW, Chen Z. Numerical study of the impact response of woodpecker’s head. AIP Adv. 2012;2:042173. [Google Scholar]
- 18.Liu Y, Qiu X, Zhang X, Yu TX. Response of woodpecker’s head during pecking process simulated by material point method. PLoS One. 2015;10:e0122677. doi: 10.1371/journal.pone.0122677. [DOI] [PMC free article] [PubMed] [Google Scholar]
- 19.Zhou P, Kong XQ, Wu CW, Chen Z. The novel mechanical property of tongue of a woodpecker. J Bionic Eng. 2009;6:214–218. [Google Scholar]
- 20.Mkukuma LD, Skakle JMS, Gibson IR, Imrie CT, Aspden RM, Hukins DWL. Effect of the proportion of organic material in bone on thermal decomposition of bone mineral: an investigation of a variety of bones from different species using thermogravimetric analysis coupled to mass spectrometry, high-temperature x-ray diffraction, and fourier transform infrared spectroscopy. Calcif Tissue Int. 2004;75:321–328. doi: 10.1007/s00223-004-0199-5. [DOI] [PubMed] [Google Scholar]
- 21.Oliver WC, Pharr GM. An improved technique for determining hardness and elastic modulus using load and displacement sensing indentation experiments. J Mater Res. 1992;7:1564–1583. [Google Scholar]
- 22.Simmons G, Wang H. Single Crystal Elastic Constants and Calculated Aggregate Properties. The MIT Press; Cambridge, MA: 1971. [Google Scholar]
- 23.Rho J-Y, Tsui TY, Pharr GM. Elastic properties of human cortical and trabecular lamellar bone measured by nanoindentation. Biomaterials. 1997;18:1325–1330. doi: 10.1016/s0142-9612(97)00073-2. [DOI] [PubMed] [Google Scholar]
- 24.Hogg RV, Ledolter J. Engineering Statistics. Macmillan; New York, NY: 1987. [Google Scholar]
- 25.Hochberg Y, Tamhane AC. Multiple Comparison Procedures. Wiley; Hoboken, NJ: 2009. [Google Scholar]
- 26.Erdoğan S, Iwasaki S-I. Function-related morphological characteristics and specialized structures of the avian tongue. Ann Anat Anatomischer Anzeiger. 2014;196:75–87. doi: 10.1016/j.aanat.2013.09.005. [DOI] [PubMed] [Google Scholar]
- 27.Rizzo D. Fundamentals of Anatomy and Physiology. Cengage Learning; Boston, MA: 2009. [Google Scholar]
- 28.Fois G, Weimer M, Busch T, Felder ET, Oswald F, von Wichert G, Seufferlein T, Dietl P, Felder E. Effects of keratin phosphorylation on the mechanical properties of keratin filaments in living cells. FASEB J. 2013;27:1322–1329. doi: 10.1096/fj.12-215632. [DOI] [PubMed] [Google Scholar]
- 29.Socrates G. Infrared and Raman Characteristic Group Frequencies: Tables and Charts. 3. John Wiley & Sons, Inc; Chichester, UK: 2001. Biological Molecules – Macromolecules. [Google Scholar]
- 30.Seki Y, Schneider MS, Meyers MA. Structure and mechanical behavior of a toucan beak. Acta Mater. 2005;53:5281–5296. [Google Scholar]
- 31.Seki Y, Kad B, Benson D, Meyers MA. The toucan beak: sructure and mechanical response. Mater Sci Eng, C. 2006;26:1412–1420. [Google Scholar]
- 32.Seki Y, Bodde SG, Meyers MA. Toucan and hornbill beaks: a comparative study. Acta Mater. 2010;6:331–343. doi: 10.1016/j.actbio.2009.08.026. [DOI] [PubMed] [Google Scholar]
- 33.Ooi C, Hamdi M, Ramesh S. Properties of hydroxyapatite produced by annealing of bovine bone. Ceram Int. 2007;33:1171–1177. [Google Scholar]
- 34.Pellegrino E, Biltz R. Mineralization in the chick embryo. Calcif Tissue Res. 1972;10:128–135. doi: 10.1007/BF02012542. [DOI] [PubMed] [Google Scholar]
- 35.Tzaphlidou M. Bone architecture: collagen structure and calcium/phosphorus maps. J Biol Phys. 2008;34:39–49. doi: 10.1007/s10867-008-9115-y. [DOI] [PMC free article] [PubMed] [Google Scholar]
- 36.Shi D. Introduction to Biomaterials. Tsinghua University Press; Beijing, China: 2006. [Google Scholar]
- 37.de Margerie E, Sanchez S, Cubo J, Castanet J. Torsional resistance as a principal component of the structural design of long bones: comparative multivariate evidence in birds. Anat Rec A: Discov Mol Cell Evol Biol. 2005;282:49–66. doi: 10.1002/ar.a.20141. [DOI] [PubMed] [Google Scholar]
- 38.Novitskaya E, Vairo MSR, Kiang J, Meyers MA, McKittrick J. Reinforcing structures in avian wing bones. In: McKittrick JM, Narayan R, editors. Advances in Bioceramics and Biotechnologies II. John Wiley & Sons, Inc; Hoboken, NJ: 2014. pp. 47–56. [Google Scholar]
- 39.Naleway SE, Porter MM, McKittrick J, Meyers MA. Structural design elements in biological materials: application to bioinspiration. Adv Mater. 2015;27:5455–5476. doi: 10.1002/adma.201502403. [DOI] [PubMed] [Google Scholar]
- 40.Rho J-Y, Pharr GM. Effects of drying on the mechanical properties of bovine femur measured by nanoindentation. J Mater Sci - Mater Med. 1999;10:485–488. doi: 10.1023/a:1008901109705. [DOI] [PubMed] [Google Scholar]
- 41.Bembey AK, Oyen ML, Bushby AJ, Boyde A. Viscoelastic properties of bone as a function of hydration state determined by nanoindentation. Phil Mag. 2006;86:5691–5703. [Google Scholar]
- 42.Boyde A. Bone Research Protocols. Springer; 2012. Scanning electron microscopy of bone; pp. 365–400. [DOI] [PubMed] [Google Scholar]
- 43.Weaver JC, Milliron GW, Miserez A, Evans-Lutterodt K, Herrera S, Gallana I, Mershon WJ, Swanson B, Zavattieri P, DiMasi E, Kisailus D. The stomatopod dactyl club: a formidable damage-tolerant biological hammer. Science. 2012;336:1275–1280. doi: 10.1126/science.1218764. [DOI] [PubMed] [Google Scholar]
- 44.Currey JD. The evolution of the mechanical properties of amniote bone. J Biomech. 1987;20:1035–1044. doi: 10.1016/0021-9290(87)90021-2. [DOI] [PubMed] [Google Scholar]
- 45.Rho J-Y, Kuhn-Spearing L, Zioupos P. Mechanical properties and the hierarchical structure of bone. Med Eng Phys. 1998;20:92–102. doi: 10.1016/s1350-4533(98)00007-1. [DOI] [PubMed] [Google Scholar]
- 46.Novitskaya E, Chen P-Y, Lee S, Castro-Ceseña A, Hirata G, Lubarda VA, McKittrick J. Anisotropy in the compressive mechanical properties of bovine cortical bone and the mineral and protein constituents. Acta Biomater. 2011;7:3170–3177. doi: 10.1016/j.actbio.2011.04.025. [DOI] [PubMed] [Google Scholar]
- 47.Boresi AP, Schmidt RJ. Advanced Mechanics of Materials. 6. John Wiley & Sons, Inc; Hoboken, NJ: 2003. [Google Scholar]
- 48.Askeland D, Wright W. The Science and Engineering of Materials. 7. Cengage Learning; Boston, MA: 2015. [Google Scholar]
- 49.Tang J, Wang Z, Mi Z, Yu Y. Finite element analysis of flat spiral spring on mechanical elastic energy storage technology. Res J Appl Sci Eng Technol. 2014;7:993–1000. [Google Scholar]
- 50.Wang L, Zhang H, Fan Y. Comparative study of the mechanical properties, micro-structure, and composition of the cranial and beak bones of the great spotted woodpecker and the lark bird. Sci China Life Sci. 2011;54:1036–1041. doi: 10.1007/s11427-011-4242-2. [DOI] [PubMed] [Google Scholar]
- 51.<http://bantams.the-kozaks.com/Bones>.
- 52.<http://digimorph.org/specimens/Melanerpes_aurifrons/>.