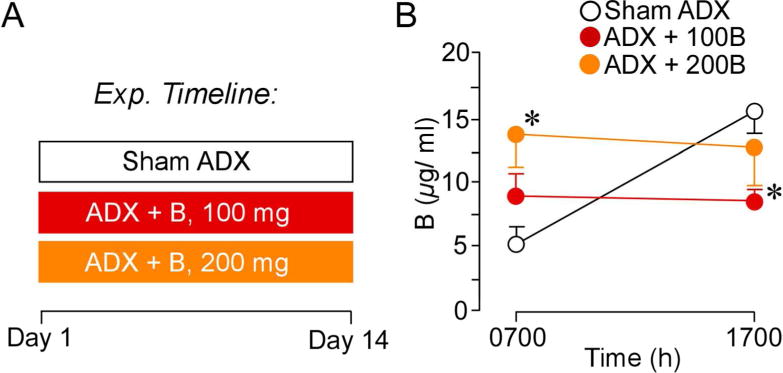
Figure 1.

A. Timeline of the first experiment. On day 1 animals underwent ADX surgeries and B pellet implantation or sham ADX and cholesterol pellet implantation. On day 14 blood was collected to assay for effectiveness of pellet increasing B levels. B. Graph depicting mean ± SEM plasma CORT levels at AM and PM sampling of B as a function of treatment group. These data reveal that 200 mg B pellets clamp levels to peak circadian levels, while 100 mg B pellets clamp B levels to values approximating the circadian mean. N = 10, control; N = 6, B100 and B200. *, p< 0.05, significantly different from sham-treated animals.
