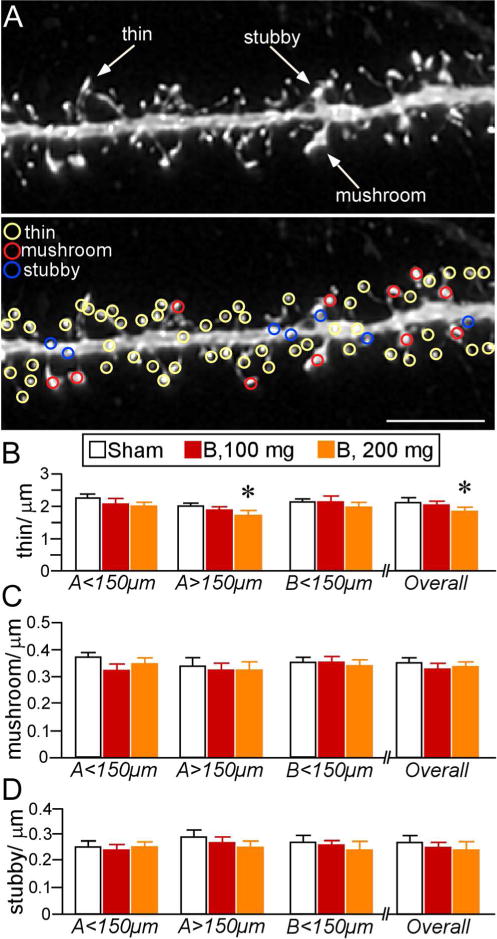
Figure 6.

A. Example of high-resolution deconvolved optical z-stack of a dendritic segment used for spine analysis with NeuronStudio Software. Open colored circles designate spine subtypes based upon user-defined parameters in the software. Scale bar, 5 μm. B–D. Mean ± SEM of dendritic spine subtypes. B. Thin spine loss was evident in B200 rats, especially at radial distances > 150 μm. No other effects were evident in other subtypes (C, D). N = 10, control; N = 6, B100 and B200. *, p < 0.05, significantly different from sham rats.
