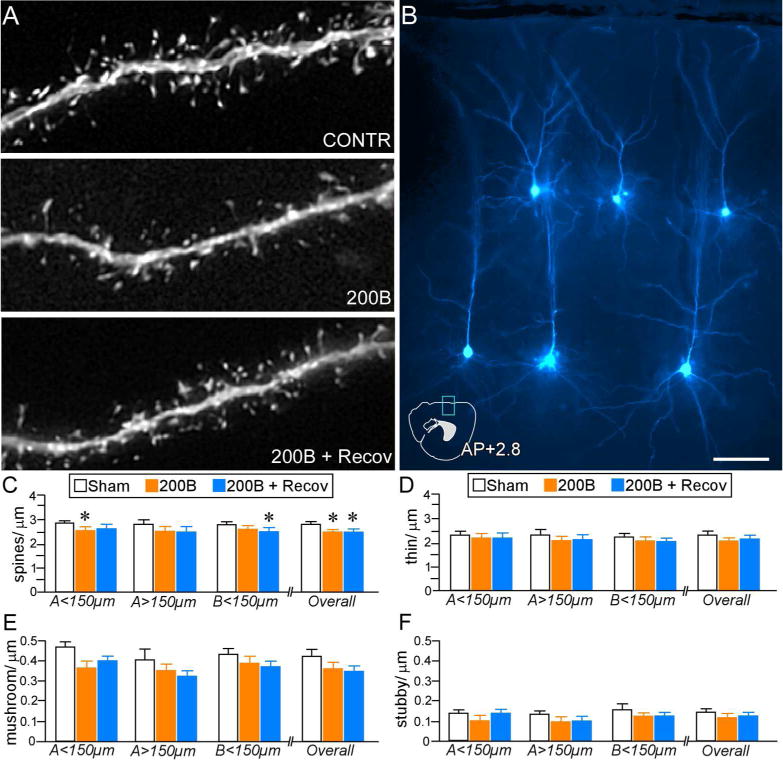
Figure 9.

A. Deconvolved images of dendritic segments from pyramidal neurons in PL from different treatment groups. B. Image depicts several layers 2, 3, and 5 dye-filled PL pyramidal neurons (pseudocolored cyan). An atlas plate (lower left) depicts the approximate location and orientation within PL of the dye-filled neurons as shown. Distance in millimeters relative to bregma is indicated. AP, anteroposterior. Scale bar, 5 μm. C. Mean + SEM of dendritic spine density and thin subtype density (D) as a function of experimental treatment. Both B200 and B200 + Recov groups show overall decreases in density relative to sham rats, whereas only B200 rats show significant reductions in overall thin subtypes. E. Mean + SEM of mushroom and stubby (F) spine densities in treatment groups. Both 200B and 200B + Recov groups display evidence of mushroom spine loss at various regions of the dendritic tree, whereas B200 + Recov rats display overall decreases, relative to sham control rats. N = 6–8 rats per group *, p< 0.05, significantly different relative to sham group.
