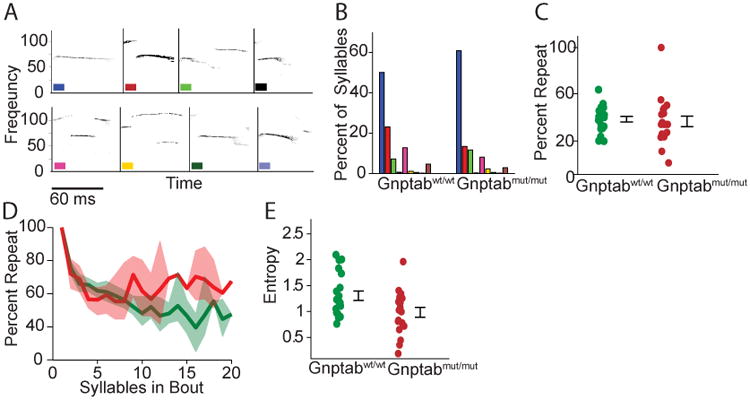
Figure 4. Mouse vocalizations from Gnptab wt/wt compared to vocalizations of Gnptab mut/mut.

(A) Syllable identification scheme showing examples of each type of syllable. (B) Percentage of each type of syllable in wild type and knock-in mice. Differences were not statistically significant. Each color represents one syllable type. (C) Percentage of times that one syllable type was followed by the same syllable type. Differences were not statistically significant. (D) Percentage of syllables that were of the same type as the mode of each bout, for bout sizes ranging from 1 to 20. Data from Gnptab wt/wt and Gnptab mut/mut . Shaded areas represent 95% confidence intervals. (E) Diversity of vocalization sequences as quantified by the entropy of the corresponding first order Markov process (t-test, p<0.022). See also Figure S4 and S5.
