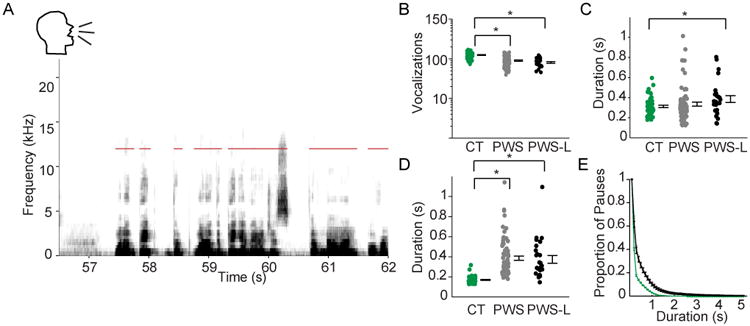
Figure 6. Vocalizations of human controls, PWS, and PWS with a known mutation in the LETP, as measured by a language agnostic analysis.

(A) Sonogram of a person saying, “(Breath) One of big…the…one of the big advantages of nylon over” while reading from a standard diagnostic script. Red bars indicate detected vocalization intervals. (B) Vocalizations per minute in the control subjects reading the script (CT; green, n=51), PWS (PWS; gray, n=74), and PWS with a known mutation in the LETP reading the same script (PWS-L; black, n=26). Each dot represents the mean of one subject. Error bars represent standard error of the mean across individuals. Brackets and stars indicate significance. There was a significant decrease in the number of vocalizations in PWS group (t-test, p<10-11), and in the PWS-L (t-test, p<10-11) group compared to the CT group. Data on log scale. (C) Duration of vocalizations. Note there was no significant difference in the duration of vocalizations between the CT and PWS groups while there was a significant difference between the CT and PWS-L groups (t-test, p<0.02). (D) Mean pause duration between vocalizations, with a significant increase in the PWS group (t-test, p< 10-12) as well as in the PWS-L group (t-test, p< 10-9) compared to the CT group. (E) Proportion of long pauses, with a steadily increasing criterion for ‘long pauses’, in the recordings of the subjects reading the script using the same color scheme as in panels B-D showing that over a range of criteria, PWS in both categories had more ‘long’ pauses. Bars indicate standard error of mean. See also Table S1.
