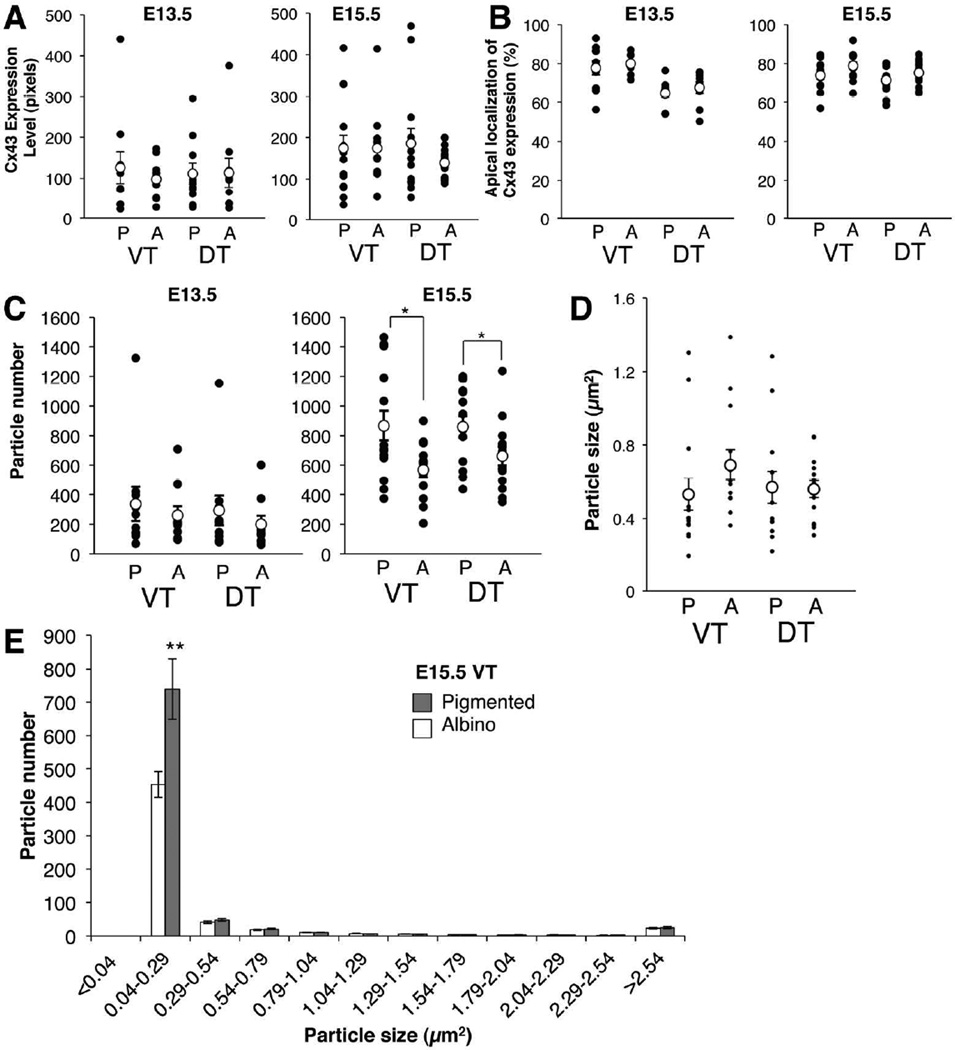
Figure 7. Quantification of Cx43 expression and distribution in RPE cells at E13.5 and E15.5 in VT and DT regions.
A: Cx43 expression level, calculated as integrated density of Cx43 labeling/ area of RPE. B: Percent of Cx43 expression in the apical or non-apical region of RPE cells. The apical region is defined as the most apical third of the RPE, and the non-apical region is defined as the remaining two-thirds. Percent of Cx43 expression is calculated by dividing Cx43 expression level (analyzed in A) within apical region or non-apical region by total Cx43 expression level. C: Cx43 particle number in the RPE. D: Size of Cx43 particles. A–D: P, pigmented RPE; A, albino RPE; VT, ventrotemporal RPE; DT, dorsotemporal RPE; Black dots, individual measurements; white dots, average values (± SEM). E: Histogram of Cx43 particle size. Albino RPE have fewer small Cx43 positive particles compared with pigmented RPE. Bars represent mean (± SEM). *P < 0.05, ** P = 0.01 (actual P values: A. E13.5 VT P > 0.999, DT P > 0.999 by Mann-Whitney test, E15.5 VT P = 0.5502 by Mann-Whitney test, DT P = 0.2408 by Welch's t test. B. E13.5 VT P = 0.9705 by Mann-Whitney test, DT P = 0.4168 by unpaired t test, E15.5 VT P = 0.0806, DT P = 0.1582 by unpaired t test. C. E13.5 VT P = 0.9705, DT P = 0.4002 by Mann-Whitney test, E15.5 VT P = 0.0159, DT P = 0.0475 by unpaired t test. D. VT P = 0.0427, DT P = 0.6500 by Mann-Whitney test. E. P =0.01 by Welch's t test). n = 5 pigmented embryos and 5 albino littermate embryos from 3 litters at E13.5; 7 pigmented embryos and 7 albino littermate embryos from 5 litters at E15.5.

