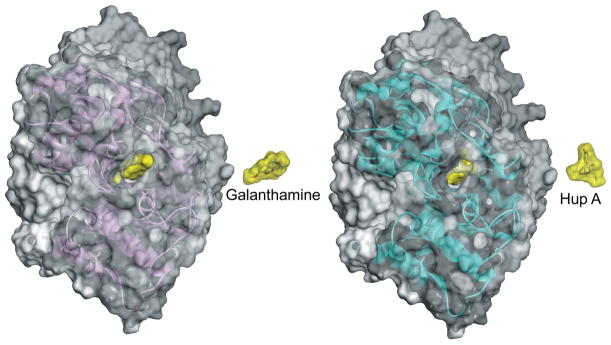
Figure 1.
A view down the human AChE active-center gorge in X-ray structures of complexes with galantamine (left) and huperzine A (Hup A; right). Bound ligands are represented as yellow Connolly surfaces in the hAChE active-center gorge. Additional copies of ligands are shown next to hAChE molecules to better illustrate their relative sizes. Human AChE molecules are represented as red (galantamine complex; PDB ID 4EY6) and blue (huperzine A complex; PDB ID 4EY5) transparent Connolly surfaces with corresponding Cα backbone ribbons. Hydrogen atoms are included in all surface calculations with 1.4-Å probe size.

