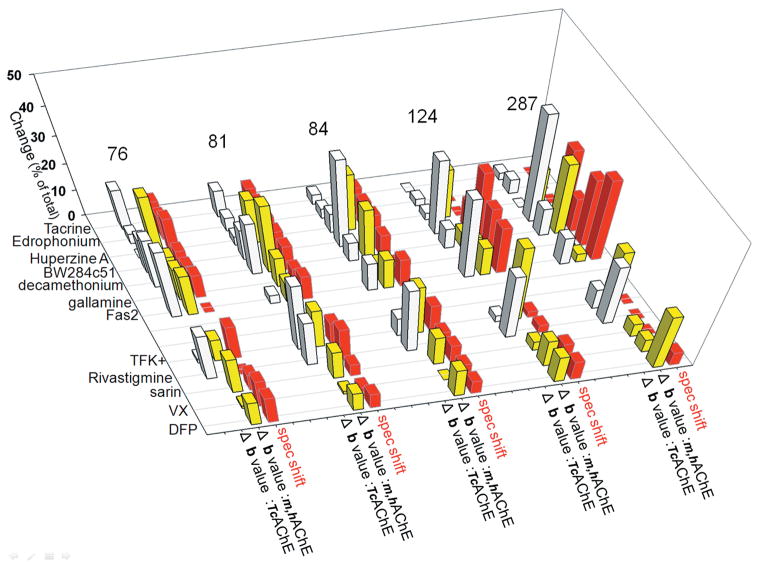
Figure 4.
Graphical comparison of ligand-associated spectral shifts of acrylodan with ligand-associated variability of X-ray B factor values (Δ B value) to the active-center serine observed from X-ray structures (cf. Fig. 2, Table 2). Absolute values of the magnitude changes in both spectral shifts and Δ B value are represented as the percentage of total change observed at each of the acrylodan-labeling sites to facilitate their comparison. Adapted from data published in Refs. 12 and 13.

