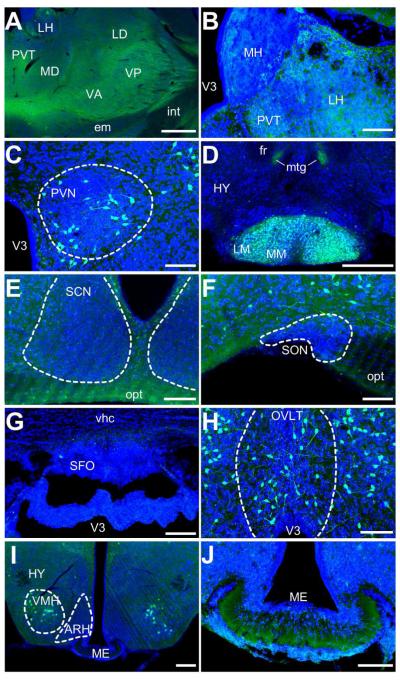
Figure 5. EGFP-immunoreactivity in the thalamus and hypothalamus.
A) Low-resolution image of a broad portion of the thalamus showing immunoreactivity in a fibrous pattern in several locations, including the lateral habenula (LH), paraventricular nucleus of the thalamus (PVT), the medial and lateral dorsal nuclei (MD and LD, respectively), and the ventral anteriolateral and posterior nuclei (VA and VP, respectively). Scale bar = 500μm. B) Confocal image of the medial habenula (MH), LHT and PVT. At this resolution, no labeled cell bodies are observed, but some diffuse fluorescence is found in the LH and PVT. Scale bar = 100μm. C) Confocal image of the paraventricular nucleus (PVN of the hypothalamus (HY). Labeled cells appear to project processes outside of the nucleus and may be parvo- or magnocellular projection neurons, or both. Scale bar = 100μm. D) Low-resolution image highlighting the intense cellular and neuropil staining of the medial and lateral mammillary nuclei (MM and LM, respectively). Some additional fibrous staining is seen in the mammilotegmental tract (mtg). Scale bar = 500μm. E) Confocal image showing sparse EGFP immunoreactivity in the suprachiasmatic nucleus (SCN). While general immunoreactivity in the nucleus is less than the surrounding tissues, some intense, punctate fluorescence is observed. Scale bar = 100μm. The optic tract shows fibrous staining. Scattered neurons are labeled in the neighboring areas of the hypothalamus. Scale bar = 200μm. F) Confocal image showing sparse immunoreactivity in the suproptic nucleus (SON). Scale bar = 200μm. G) Confocal image of the subfornical organ (SFO). Little, if any, immunoreactivity is observed in this region. Scale bar = 100μm. H) Confocal image of the vascular organ of the lamina terminalis (OVLT). EGFP-labeled cells have a neuronal morphology in this region. Scale bar = 100μm. I) Low-resolution image showing intensely labeled cell bodies and processes in the ventromedial nucleus of the hypothalamus (VMH). Scale bar = 200μm. J) Confocal image showing the median eminence (ME) at a higher resolution. Diffuse immunofluorescence is observed in the ventral portion, with more punctate expression in the dorsal portion. Scale bar = 100μm.

