
Figure 6. EGFP-immunoreactivity in the midbrain and medulla.
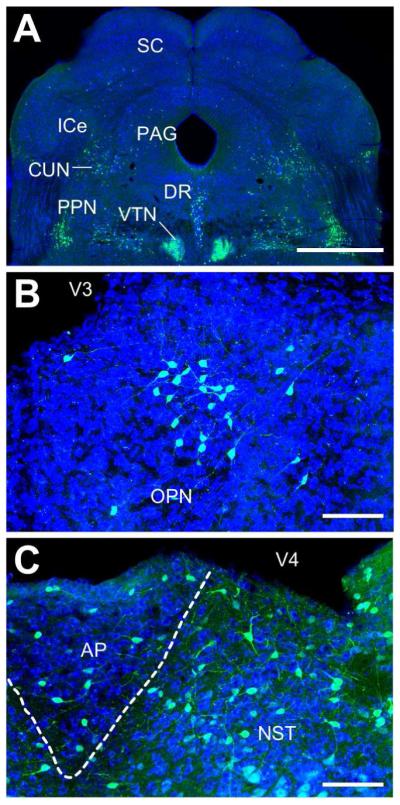
A) Low-resolution image showing several midbrain areas containing cell body staining of EGFP. These include the periaqueductal gray (PAG), the cuneiform (CUN), pedunculopontine (PPN), and dorsal raphe (DR) nuclei. The ventral tegmental nucleus is very densely labeled. Little staining is observed in the superior or inferior colliculi (SC and ICe, respectively). Scale bar = 500μm. B) Confocal image of the olivary pretectal nucleus (OPN). A subset of cell bodies and processes in this nucleus express EGFP. Scale bar = 100μm. C) Confocal image of area postrema (AP). A subset of cells with neuronal morphology express EGFP, though at a lower density than the neighboring nucleus of the solitary tract (NST). Scale bar = 100μm.