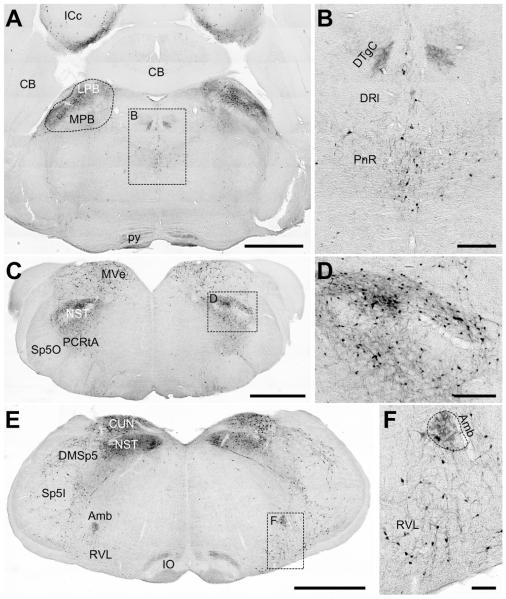
Figure 7. EGFP immunoreactivity in representative areas of the brainstem.
A) Low-resolution image of a cross-section of the hindbrain at the level of the cerebellum. Dense labeling of cell bodies is observed in the lateral and medial parabrachial nuclei (LPB and MPB, respectively). Also in the image, no significant staining is found in the cerebellum (CB). Some cells are labeled in the inferior colliculus, central nucleus (ICc), but the labeling is sparse. Scale bar = 1mm. B) High-resolution inset defined in (A), highlighting the fibrous staining pattern in the DTgC. Cellular labeling is observed in the pontine raphe nuclei (PnR). Scale bar = 200μm. C) Low-resolution image of a hindbrain cross-section more caudal than in (A). Intense EGFP immunoreactivity is found in the nuclei of the solitary tract (NST), the parvicellular reticular nucleus (PCRtA) and medial vestibular nucleus (MVe). At this level, few if any cells or fibers are found in the spinal trigeminal tract (Sp5). Scale bar = 1mm. D) High-resolution inset defined in (C) showing intensely labeled cell bodies and fibers in the NST. Scale bar = 200μm. E) Low-resolution image of a hindbrain cross-section more caudal than in (C). At this level there is also intense staining in the NST, as well as in the cuneate (CUN). Sparse cell bodies are labeled for EGFP in the dorsomedial and interpolar spinal trigeminal nuceli (DMSp5 and Sp5I, respectively). On coronal sections, the inferior olive (IO) exhibits alternating horizontal bands of high and low immunoreactivity. Scale bar = 1mm. F) High-resolution inset defined in (E) showing dense cell body and fibrous labeling in the nucleus ambiguous (Amb) and sparse labeling in the rostroventrolateral reticular nucleus (RVL). Scale bar = 100μm.

