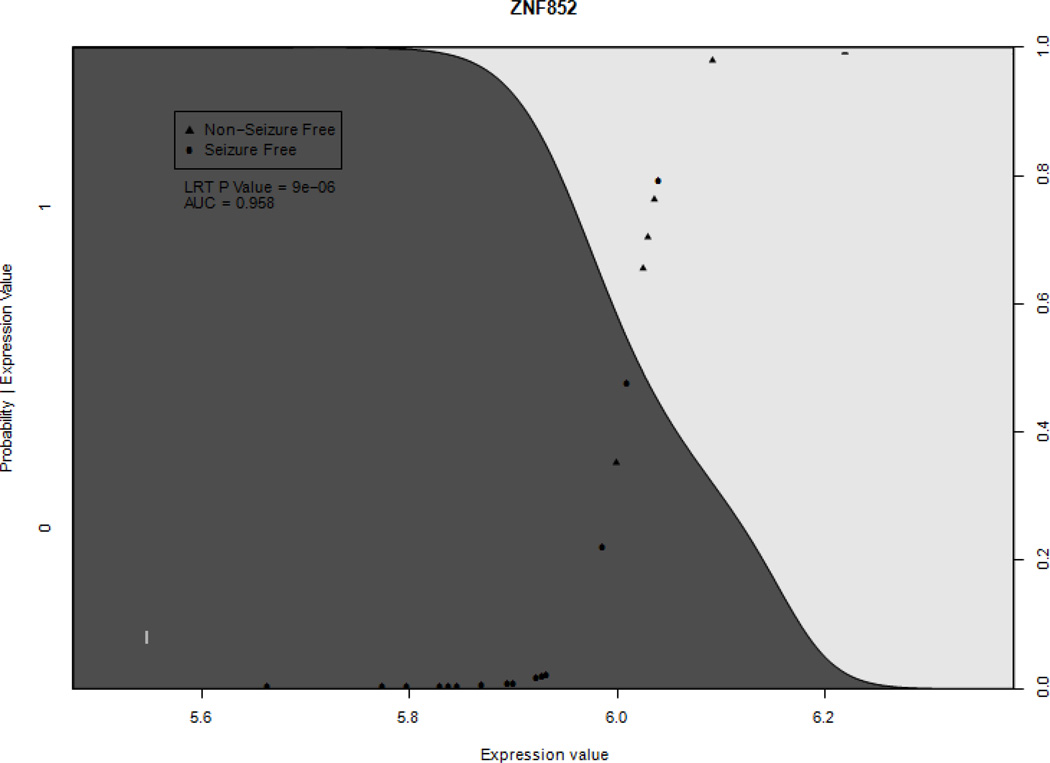
Figure 1.
Example conditional probability plots of the ZNF852 gene. Significantly different gene expression was defined as the area under receiver operating characteristic curve > 0.9 and p value < 0.05. Positive (triangle) points represent patients where seizures persisted after AHL/ATL. Shaded curve represents probability of seizure free outcome dependent on expression level

