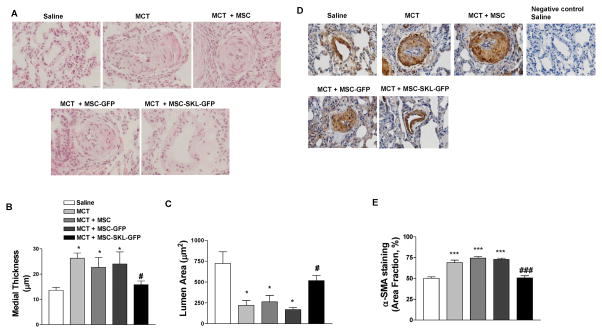
Figure 3. MSCs overexpressing SKL attenuated MCT-induced pulmonary arterial remodeling.
A) Representative H&E staining images of small pulmonary artery (PA) cross-sections (60–80 μM) in rat lungs. B) Quantitative analysis of medial thickness. C) Lumen area in rat small PA cross-sections. D) α-SMA staining using IHC in small PA cross-sections. E) Quantification of α-SMA staining. Scale bar, 20 μm. *p<0.05 vs. Saline; #p<0.05 vs. MCT. n=6. Data = means±SEM.

