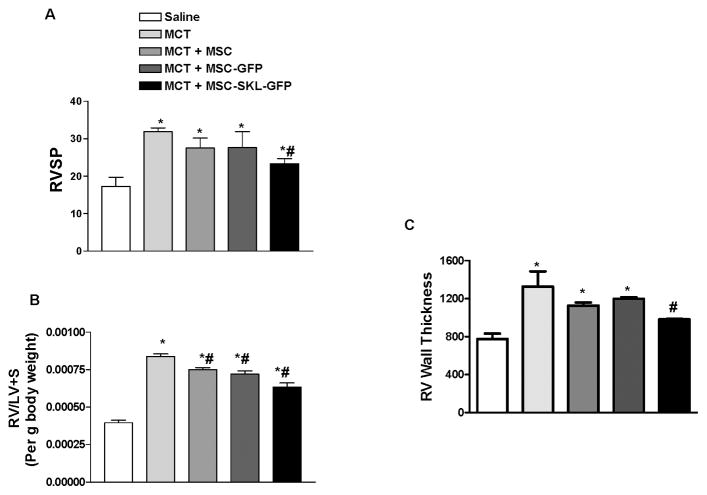
Figure 4. MSCs overexpressing SKL attenuated MCT-induced pulmonary arterial hypertension (PAH) and RV hypertrophy.
A) Right ventricular systolic blood pressure (RVSP). B) The RV/LV+S weight ratio. C) Quantification of RV wall thickness. *p<0.05 vs. Saline; #p<0.05, ##p<0.01 vs. MCT. n=6. Data = means±SEM.

