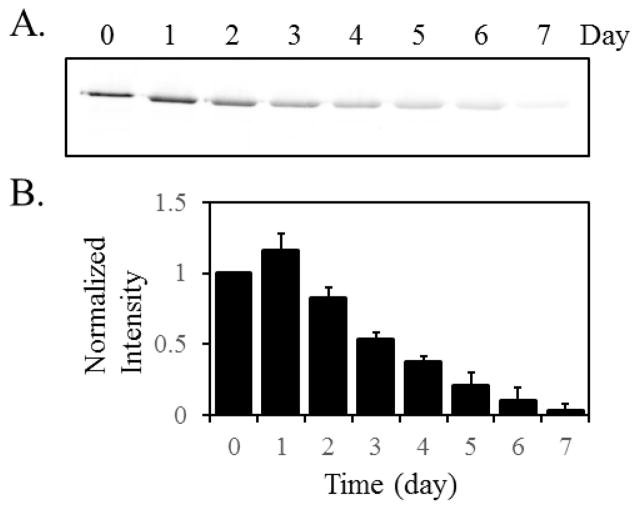
Figure 2.
A. Representative image of the result of S35-Met pulse-chase experiment over the period of seven days. Samples were collected at the indicated time after the chase. The band intensity reduced to less than 5% on day seven. B. Band intensities were measured and normalized for seven-day studies against the pre-chasing signal (time point 0). The average value and standard deviation of measurements from three independent measurements were shown. The blot image of two other experiments were shown in Electronic Supplementary Material (ESM, Fig. S1)

