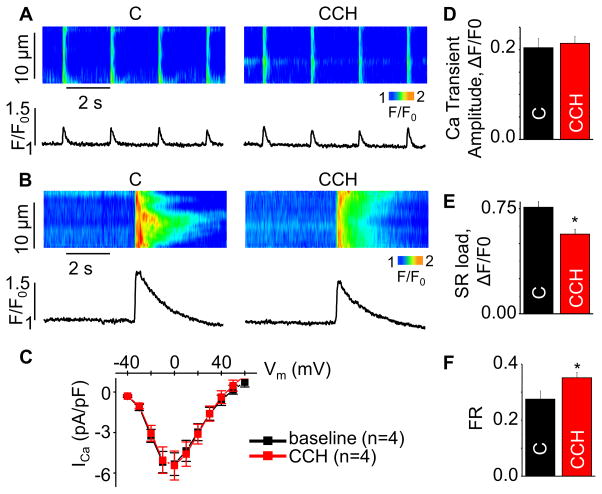
Fig. 1. Effects of CCH on Ca handling in WT mouse ventricular myocytes.
Representative line-scan images for (A) Ca transients, (B) SR Ca with or without 10 μmol/L CCH. (C) Voltage dependencies of ICa in baseline (black) and in the presence of CCH (red) (n=4). (D,E,F) Summary data for Ca transient amplitude, caffeine-induced Ca transient amplitude (SR load) and fractional release (FR) (±SEM, n=11–16). *P<0.05 vs control (C). SR Ca content was obtained by application of 20 mmol/L caffeine.

